
- Start >
- Rivers >
- Discharge >
- Oberer Main - Elbe >
- Laufermühle >
- Chart of year

Chart of year Laufermühle / Aisch
Discharge from 01.03.2022 to 28.02.2023
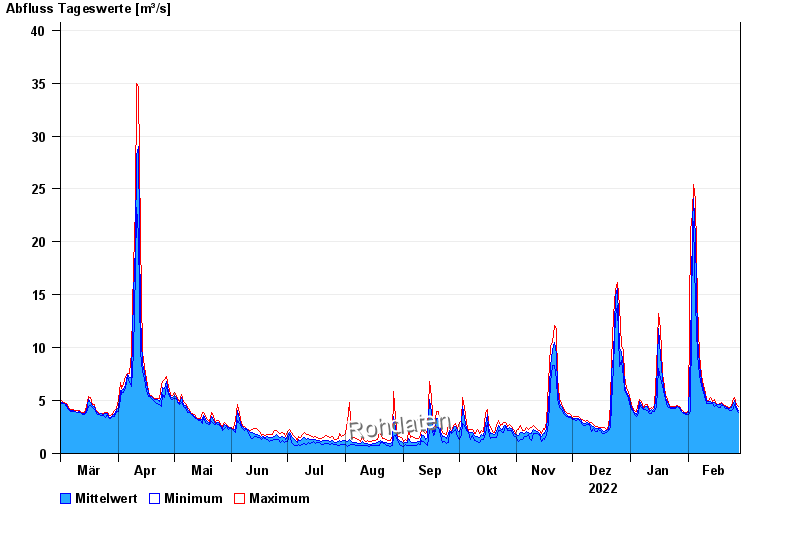
| Date | Mean value [m³/s] | Maximum [m³/s] | Minimum [m³/s] |
|---|---|---|---|
| 28.02.2023 | 4.04 | 4.41 | 3.9 |
| 27.02.2023 | 4.38 | 4.67 | 4.15 |
| 26.02.2023 | 5.03 | 5.26 | 4.67 |
| 25.02.2023 | 4.68 | 5.2 | 4.22 |
| 24.02.2023 | 4.31 | 4.41 | 4.02 |
| 23.02.2023 | 4.23 | 4.35 | 4.09 |
| 22.02.2023 | 4.37 | 4.41 | 4.28 |
© Bayerisches Landesamt für Umwelt 2024