
- Start >
- Rivers >
- Discharge >
- Oberer Main - Elbe >
- Langenau >
- Chart of year

Chart of year Langenau / Langenaubach
Discharge from 29.03.2024 to 28.03.2025
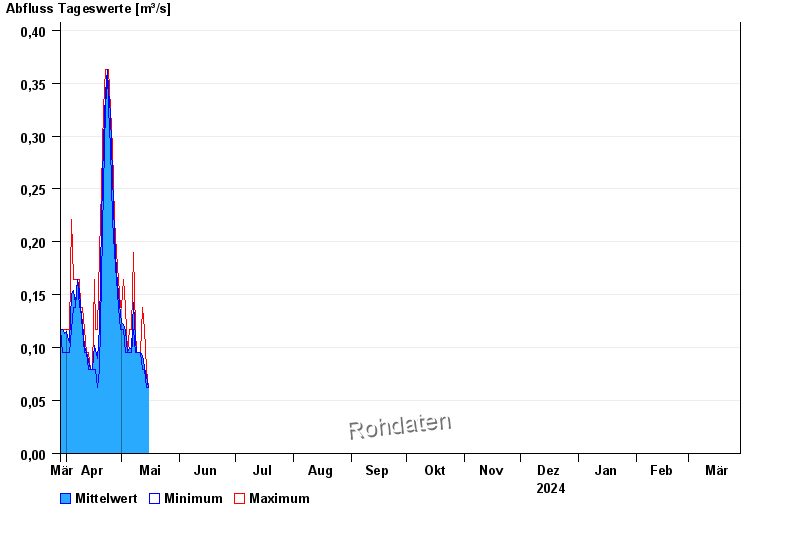
| Date | Mean value [m³/s] | Maximum [m³/s] | Minimum [m³/s] |
|---|---|---|---|
| 29.04.2024 | 0.164 | 0.164 | 0.164 |
| 28.04.2024 | 0.172 | 0.19 | 0.164 |
| 27.04.2024 | 0.207 | 0.221 | 0.19 |
| 26.04.2024 | 0.263 | 0.289 | 0.221 |
| 25.04.2024 | 0.32 | 0.326 | 0.289 |
| 24.04.2024 | 0.343 | 0.363 | 0.326 |
| 23.04.2024 | 0.363 | 0.363 | 0.363 |
© Bayerisches Landesamt für Umwelt 2024