
- Start >
- Rivers >
- Discharge >
- Oberer Main - Elbe >
- Langenau >
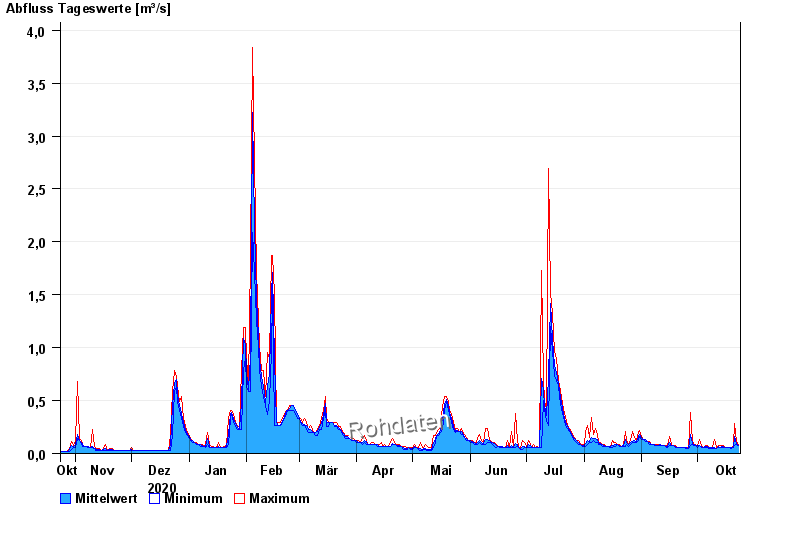
- Chart of year

Chart of year Langenau / Langenaubach
Discharge from 24.10.2020 to 23.10.2021
| Date | Mean value [m³/s] | Maximum [m³/s] | Minimum [m³/s] |
|---|---|---|---|
| 23.10.2021 | 0.078 | 0.089 | 0.074 |
| 22.10.2021 | 0.096 | 0.111 | 0.089 |
| 21.10.2021 | 0.162 | 0.279 | 0.074 |
| 20.10.2021 | 0.059 | 0.074 | 0.058 |
| 19.10.2021 | 0.057 | 0.058 | 0.044 |
| 18.10.2021 | 0.058 | 0.058 | 0.058 |
| 17.10.2021 | 0.058 | 0.058 | 0.058 |
© Bayerisches Landesamt für Umwelt 2024