
- Start >
- Rivers >
- Discharge >
- Oberer Main - Elbe >
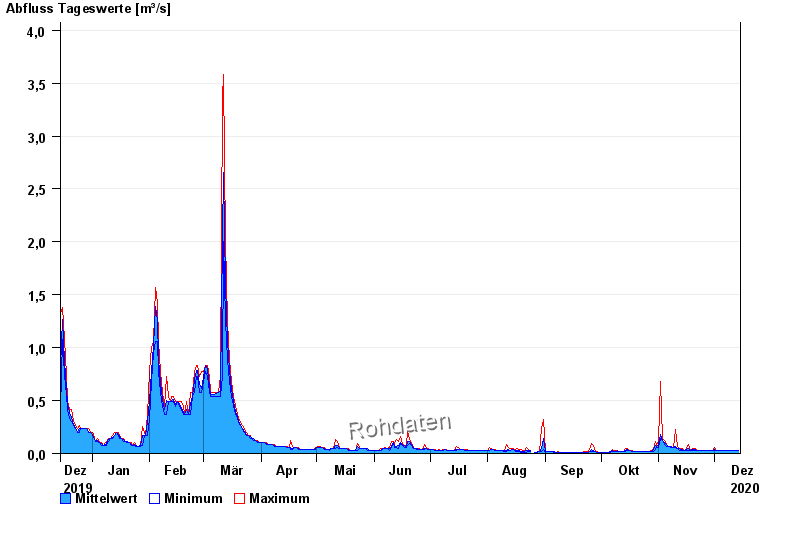
- Langenau >
- Chart of year

Chart of year Langenau / Langenaubach
Discharge from 15.12.2019 to 14.12.2020
| Date | Mean value [m³/s] | Maximum [m³/s] | Minimum [m³/s] |
|---|---|---|---|
| 14.12.2020 | 0.025 | 0.025 | 0.025 |
| 13.12.2020 | 0.028 | 0.033 | 0.025 |
| 12.12.2020 | 0.031 | 0.033 | 0.025 |
| 11.12.2020 | 0.033 | 0.033 | 0.033 |
| 10.12.2020 | 0.033 | 0.033 | 0.033 |
| 09.12.2020 | 0.028 | 0.033 | 0.025 |
| 08.12.2020 | 0.03 | 0.033 | 0.025 |
© Bayerisches Landesamt für Umwelt 2024