
- Start >
- Rivers >
- Discharge >
- Oberer Main - Elbe >
- Langenau >
- Chart of year

Chart of year Langenau / Langenaubach
Discharge from 15.11.2022 to 14.11.2023
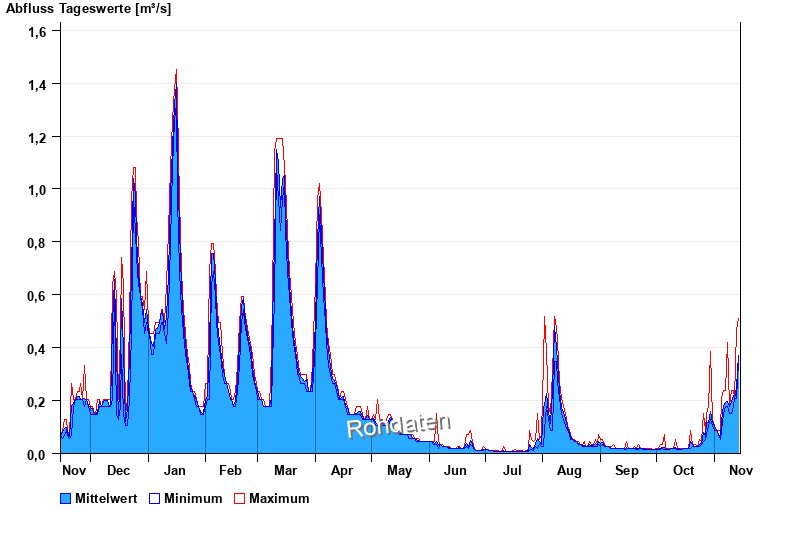
| Date | Mean value [m³/s] | Maximum [m³/s] | Minimum [m³/s] |
|---|---|---|---|
| 14.11.2023 | 0.371 | 0.512 | 0.345 |
| 13.11.2023 | 0.248 | 0.467 | 0.207 |
| 12.11.2023 | 0.207 | 0.207 | 0.207 |
| 11.11.2023 | 0.218 | 0.238 | 0.179 |
| 10.11.2023 | 0.198 | 0.238 | 0.152 |
| 09.11.2023 | 0.179 | 0.179 | 0.152 |
| 08.11.2023 | 0.196 | 0.421 | 0.179 |
© Bayerisches Landesamt für Umwelt 2025