
- Start >
- Rivers >
- Discharge >
- Oberer Main - Elbe >
- Langenau >
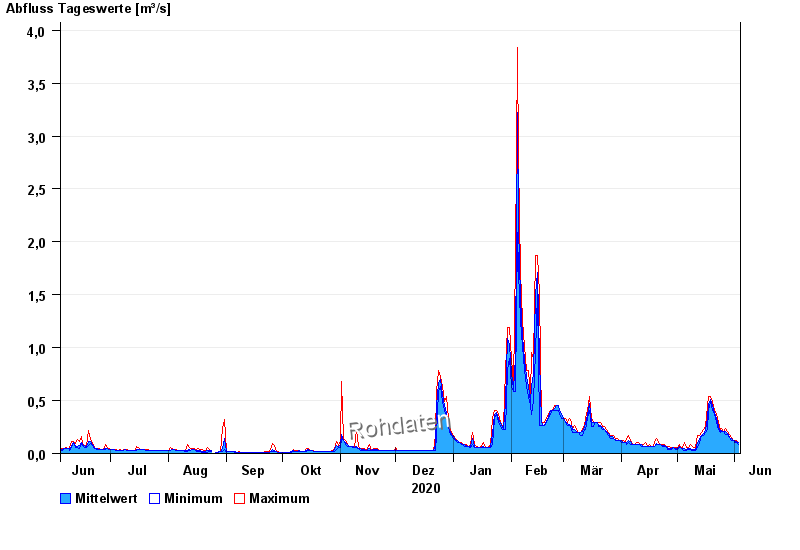
- Chart of year

Chart of year Langenau / Langenaubach
Discharge from 04.06.2020 to 03.06.2021
| Date | Mean value [m³/s] | Maximum [m³/s] | Minimum [m³/s] |
|---|---|---|---|
| 03.06.2021 | 0.105 | 0.105 | 0.084 |
| 02.06.2021 | 0.113 | 0.124 | 0.105 |
| 01.06.2021 | 0.121 | 0.124 | 0.105 |
| 31.05.2021 | 0.124 | 0.124 | 0.124 |
| 30.05.2021 | 0.138 | 0.15 | 0.124 |
| 29.05.2021 | 0.152 | 0.175 | 0.15 |
| 28.05.2021 | 0.189 | 0.205 | 0.175 |
© Bayerisches Landesamt für Umwelt 2024