
- Start >
- Rivers >
- Discharge >
- Oberer Main - Elbe >
- Langenau >
- Chart of year

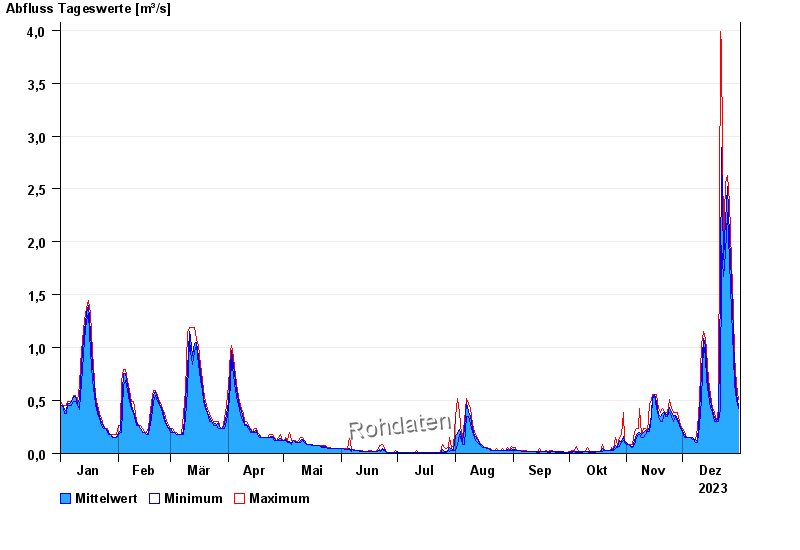
Chart of year Langenau / Langenaubach
Discharge from 01.01.2023 to 31.12.2023
| Date | Mean value [m³/s] | Maximum [m³/s] | Minimum [m³/s] |
|---|---|---|---|
| 31.12.2023 | 0.447 | 0.512 | 0.421 |
| 30.12.2023 | 0.57 | 0.653 | 0.512 |
| 29.12.2023 | 0.784 | 0.92 | 0.653 |
| 28.12.2023 | 1.13 | 1.34 | 0.92 |
| 27.12.2023 | 1.63 | 1.81 | 1.34 |
| 26.12.2023 | 2.05 | 2.37 | 1.81 |
| 25.12.2023 | 2.52 | 2.63 | 2.28 |
© Bayerisches Landesamt für Umwelt 2024