
- Start >
- Rivers >
- Discharge >
- Oberer Main - Elbe >
- Kösfeld >
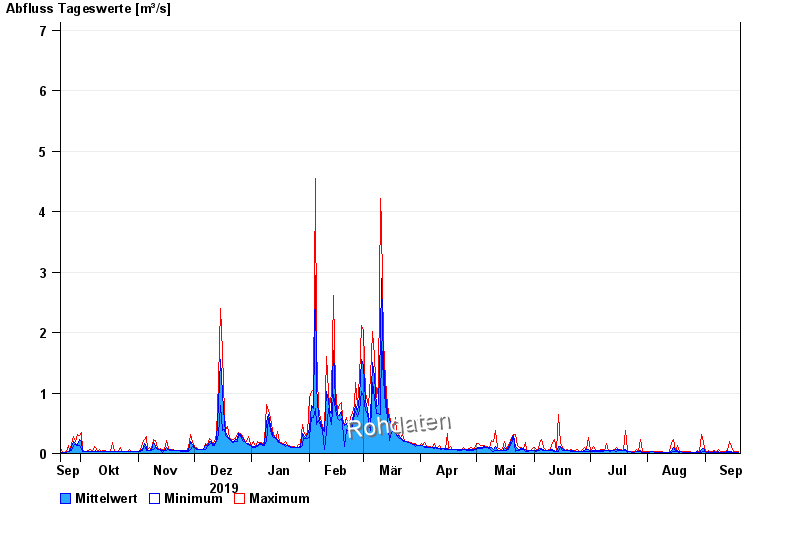
- Chart of year

Chart of year Kösfeld / Sulzbach
Discharge from 20.09.2019 to 19.09.2020
- 07.05.2004 Abfluss: 14,9 m³/s
- 23.01.1995 Abfluss: 11,1 m³/s
- 03.01.2003 Abfluss: 9,33 m³/s
- 07.01.2011 Abfluss: 7,36 m³/s
- 02.01.1987 Abfluss: 7,15 m³/s
| Date | Mean value [m³/s] | Maximum [m³/s] | Minimum [m³/s] |
|---|---|---|---|
| 19.09.2020 | 0.021 | 0.025 | 0.019 |
| 18.09.2020 | 0.021 | 0.025 | 0.019 |
| 17.09.2020 | 0.023 | 0.025 | 0.019 |
| 16.09.2020 | 0.02 | 0.025 | 0.014 |
| 15.09.2020 | 0.029 | 0.115 | 0.019 |
| 14.09.2020 | 0.028 | 0.192 | 0.019 |
| 13.09.2020 | 0.028 | 0.055 | 0.019 |
© Bayerisches Landesamt für Umwelt 2024