
- Start >
- Rivers >
- Discharge >
- Oberer Main - Elbe >
- Kösfeld >
- Chart of year

Chart of year Kösfeld / Sulzbach
Discharge from 19.11.2019 to 18.11.2020
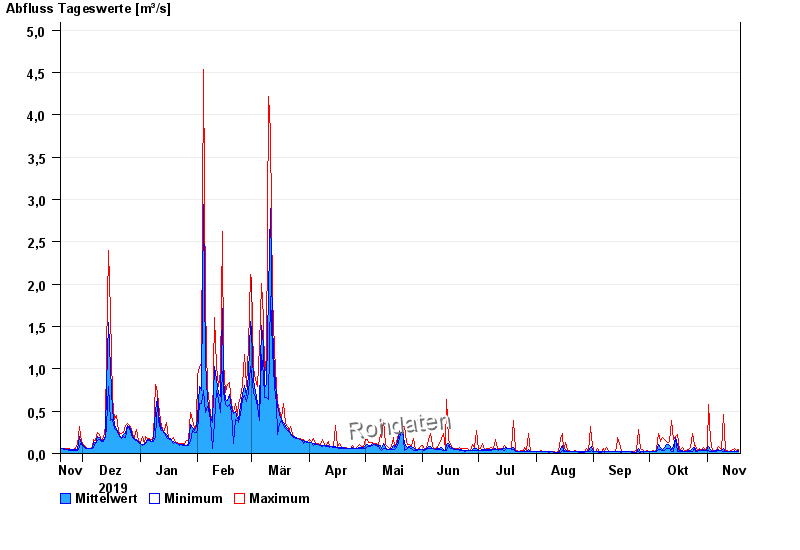
| Date | Mean value [m³/s] | Maximum [m³/s] | Minimum [m³/s] |
|---|---|---|---|
| 18.11.2020 | 0.04 | 0.047 | 0.025 |
| 17.11.2020 | 0.026 | 0.032 | 0.025 |
| 16.11.2020 | 0.037 | 0.064 | 0.025 |
| 15.11.2020 | 0.029 | 0.047 | 0.025 |
| 14.11.2020 | 0.025 | 0.032 | 0.025 |
| 13.11.2020 | 0.025 | 0.025 | 0.025 |
| 12.11.2020 | 0.027 | 0.032 | 0.025 |
© Bayerisches Landesamt für Umwelt 2024