
- Start >
- Rivers >
- Discharge >
- Oberer Main - Elbe >
- Kösfeld >
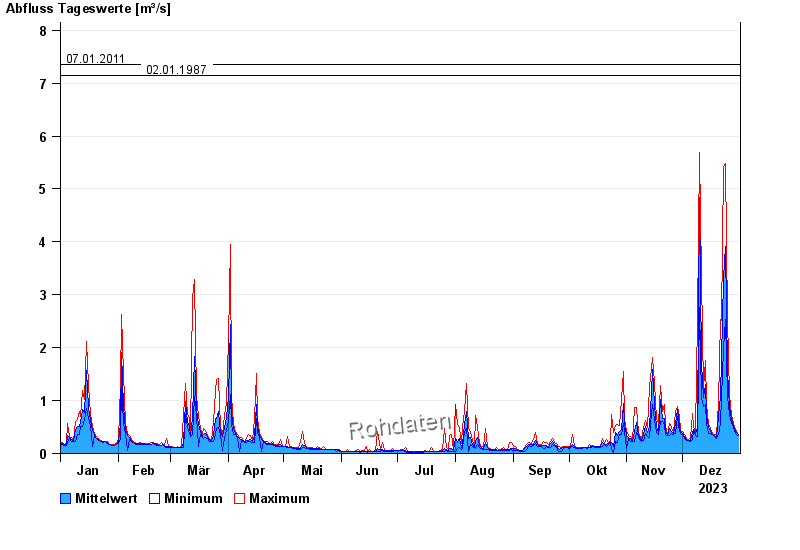
- Chart of year

Chart of year Kösfeld / Sulzbach
Discharge from 01.01.2023 to 31.12.2023
Rückstau
Pegelstand / Abfluss beeinflusst durch Biberbauten im Unterlauf.
- 07.05.2004 Abfluss: 14,9 m³/s
- 23.01.1995 Abfluss: 11,1 m³/s
- 03.01.2003 Abfluss: 9,33 m³/s
- 07.01.2011 Abfluss: 7,36 m³/s
- 02.01.1987 Abfluss: 7,15 m³/s
| Date | Mean value [m³/s] | Maximum [m³/s] | Minimum [m³/s] |
|---|---|---|---|
| 31.12.2023 | 0.358 | 0.368 | 0.332 |
| 30.12.2023 | 0.391 | 0.425 | 0.368 |
| 29.12.2023 | 0.451 | 0.485 | 0.425 |
| 28.12.2023 | 0.52 | 0.573 | 0.485 |
| 27.12.2023 | 0.634 | 0.715 | 0.573 |
| 26.12.2023 | 0.893 | 1.11 | 0.74 |
| 25.12.2023 | 1.55 | 2.54 | 1.08 |
© Bayerisches Landesamt für Umwelt 2025