
- Start >
- Rivers >
- Discharge >
- Oberer Main - Elbe >
- Kautendorf >
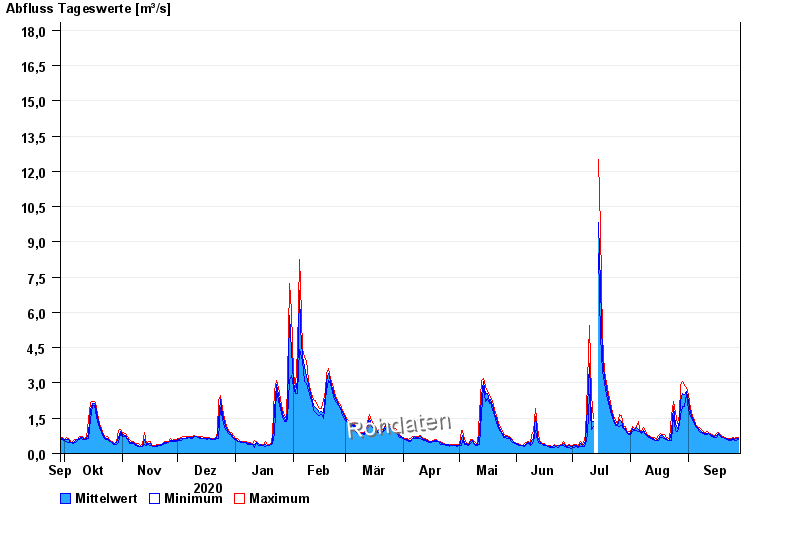
- Chart of year

Chart of year Kautendorf / Südliche Regnitz
Discharge from 29.09.2020 to 28.09.2021
note
- 02.06.2013 Abfluss: 40,9 m³/s
- 24.07.2010 Abfluss: 25,1 m³/s
- 14.01.2011 Abfluss: 24,1 m³/s
- 27.03.2006 Abfluss: 20 m³/s
- 24.12.2012 Abfluss: 19,3 m³/s
| Date | Mean value [m³/s] | Maximum [m³/s] | Minimum [m³/s] |
|---|---|---|---|
| 28.09.2021 | 0.639 | 0.66 | 0.596 |
| 27.09.2021 | 0.627 | 0.66 | 0.564 |
| 26.09.2021 | 0.595 | 0.628 | 0.564 |
| 25.09.2021 | 0.625 | 0.66 | 0.596 |
| 24.09.2021 | 0.597 | 0.628 | 0.564 |
| 23.09.2021 | 0.603 | 0.628 | 0.564 |
| 22.09.2021 | 0.624 | 0.628 | 0.596 |
© Bayerisches Landesamt für Umwelt 2024