
- Start >
- Rivers >
- Discharge >
- Oberer Main - Elbe >
- Kautendorf >
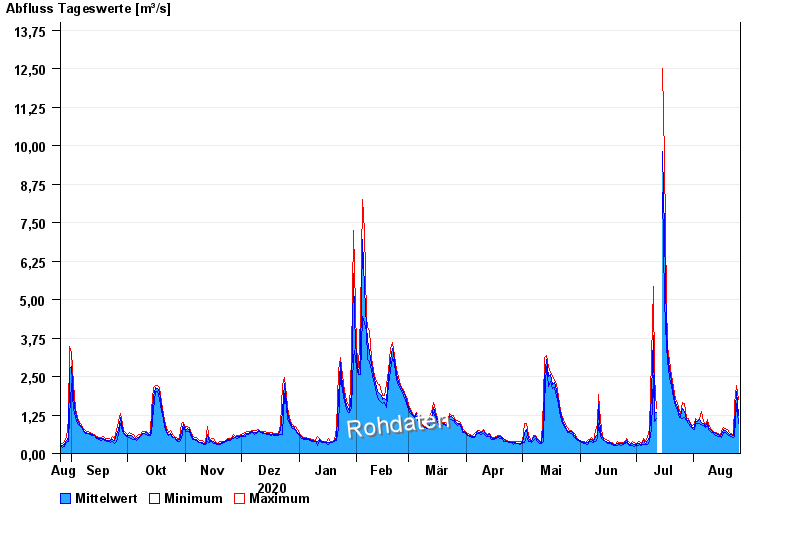
- Chart of year

Chart of year Kautendorf / Südliche Regnitz
Discharge from 26.08.2020 to 25.08.2021
note
| Date | Mean value [m³/s] | Maximum [m³/s] | Minimum [m³/s] |
|---|---|---|---|
| 25.08.2021 | 1.11 | 1.62 | 0.887 |
| 24.08.2021 | 1.81 | 1.98 | 1.47 |
| 23.08.2021 | 0.812 | 1.47 | 0.489 |
| 22.08.2021 | 0.488 | 0.489 | 0.46 |
| 21.08.2021 | 0.516 | 0.548 | 0.489 |
| 20.08.2021 | 0.542 | 0.577 | 0.518 |
| 19.08.2021 | 0.59 | 0.699 | 0.548 |
© Bayerisches Landesamt für Umwelt 2024