
- Start >
- Rivers >
- Discharge >
- Oberer Main - Elbe >
- Kautendorf >
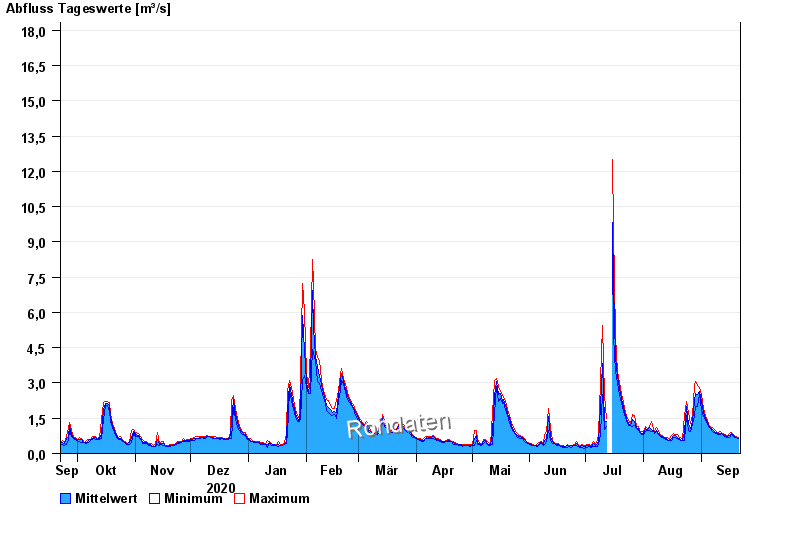
- Chart of year

Chart of year Kautendorf / Südliche Regnitz
Discharge from 22.09.2020 to 21.09.2021
note
- 02.06.2013 Abfluss: 40,9 m³/s
- 24.07.2010 Abfluss: 25,1 m³/s
- 14.01.2011 Abfluss: 24,1 m³/s
- 27.03.2006 Abfluss: 20 m³/s
- 24.12.2012 Abfluss: 19,3 m³/s
| Date | Mean value [m³/s] | Maximum [m³/s] | Minimum [m³/s] |
|---|---|---|---|
| 21.09.2021 | 0.647 | 0.692 | 0.628 |
| 20.09.2021 | 0.696 | 0.723 | 0.66 |
| 19.09.2021 | 0.727 | 0.755 | 0.692 |
| 18.09.2021 | 0.769 | 0.819 | 0.723 |
| 17.09.2021 | 0.837 | 0.882 | 0.787 |
| 16.09.2021 | 0.771 | 0.851 | 0.692 |
| 15.09.2021 | 0.719 | 0.755 | 0.66 |
© Bayerisches Landesamt für Umwelt 2024