
- Start >
- Rivers >
- Discharge >
- Oberer Main - Elbe >
- Kauerndorf >
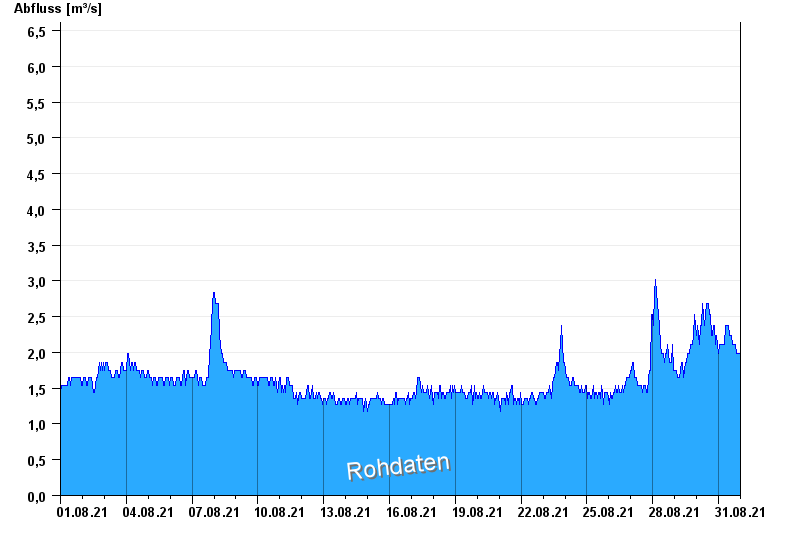
- Chart of month

Chart of month Kauerndorf / Schorgast
Discharge from 01.08.2021 to 31.08.2021
note
Bauarbeiten am Pegel
- HQ1 29 m³/s
- HQ2 40 m³/s
- HQ5 57 m³/s
- HQ10 70 m³/s
- HQ20 82 m³/s
- HQ50 98 m³/s
- HQ100 110 m³/s
| Date | Runoff [m³/s] |
|---|---|
| 01.09.2021 00:45 | 1.98 |
| 01.09.2021 00:30 | 1.98 |
| 01.09.2021 00:15 | 1.98 |
| 01.09.2021 00:00 | 1.98 |
| 31.08.2021 23:45 | 1.98 |
| 31.08.2021 23:30 | 1.98 |
| 31.08.2021 23:15 | 1.98 |
© Bayerisches Landesamt für Umwelt 2024