
- Start >
- Rivers >
- Discharge >
- Oberer Main - Elbe >
- Kalteneck >
- Chart of total period

Chart of total period Kalteneck / Ilz
Discharge from 01.02.1900 to 26.04.2024
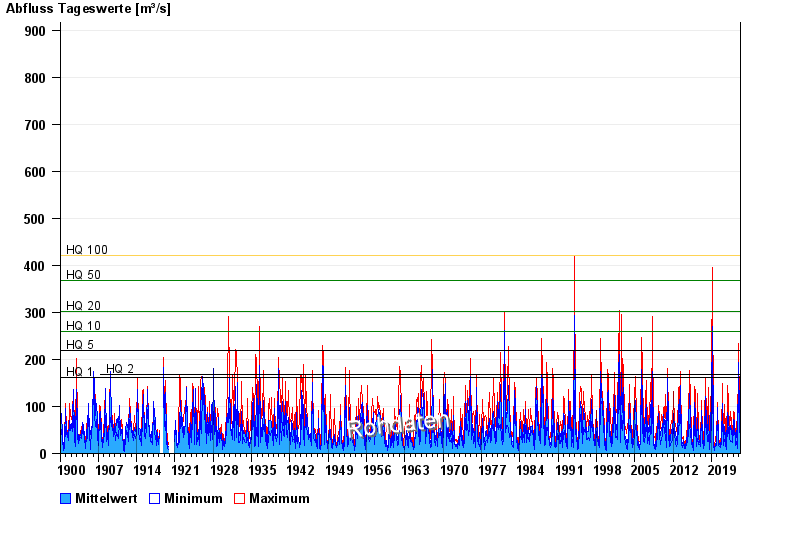
- HQ1 162 m³/s
- HQ2 168 m³/s
- HQ5 218 m³/s
- HQ10 259 m³/s
- HQ20 302 m³/s
- HQ50 367 m³/s
- HQ100 421 m³/s
| Date | Mean value [m³/s] | Maximum [m³/s] | Minimum [m³/s] |
|---|---|---|---|
| 26.04.2024 | 14.5 | 15.1 | 13 |
| 25.04.2024 | 14.6 | 15.5 | 12.6 |
| 24.04.2024 | 14.6 | 16 | 12.6 |
| 23.04.2024 | 16 | 17.4 | 13.8 |
| 22.04.2024 | 19.2 | 21.6 | 16.9 |
| 21.04.2024 | 26.2 | 34 | 21.1 |
| 20.04.2024 | 36.8 | 39.4 | 32.3 |
© Bayerisches Landesamt für Umwelt 2024