
- Start >
- Rivers >
- Discharge >
- Oberer Main - Elbe >
- Hollfeld >
- Chart of year

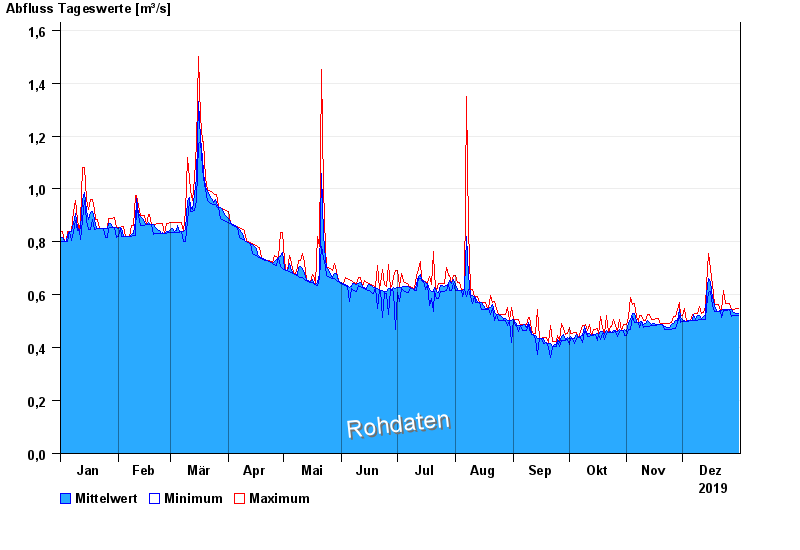
Chart of year Hollfeld / Wiesent
Discharge from 01.01.2019 to 31.12.2019
| Date | Mean value [m³/s] | Maximum [m³/s] | Minimum [m³/s] |
|---|---|---|---|
| 31.12.2019 | 0.528 | 0.548 | 0.522 |
| 30.12.2019 | 0.528 | 0.547 | 0.521 |
| 29.12.2019 | 0.534 | 0.546 | 0.52 |
| 28.12.2019 | 0.534 | 0.545 | 0.52 |
| 27.12.2019 | 0.543 | 0.544 | 0.519 |
| 26.12.2019 | 0.543 | 0.568 | 0.543 |
| 25.12.2019 | 0.544 | 0.568 | 0.542 |
© Bayerisches Landesamt für Umwelt 2024