
- Start >
- Rivers >
- Discharge >
- Oberer Main - Elbe >
- Hohenberg >
- Chart of year

Chart of year Hohenberg / Eger
Discharge from 29.03.2023 to 28.03.2024
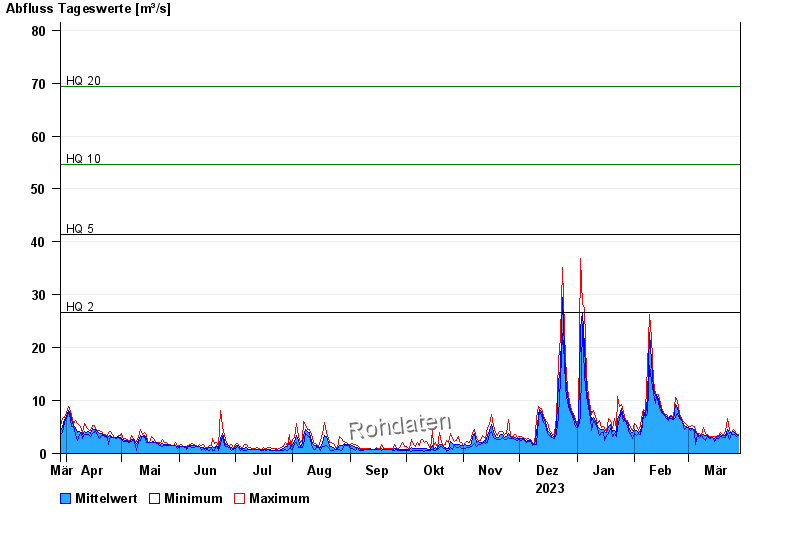
- HQ2 26,6 m³/s
- HQ5 41,3 m³/s
- HQ10 54,6 m³/s
- HQ20 69,4 m³/s
- HQ50 91,5 m³/s
- HQ100 112 m³/s
| Date | Mean value [m³/s] | Maximum [m³/s] | Minimum [m³/s] |
|---|---|---|---|
| 28.03.2024 | 3.45 | 3.59 | 3.39 |
| 27.03.2024 | 3.54 | 3.69 | 3.3 |
| 26.03.2024 | 3.96 | 4.3 | 3.59 |
| 25.03.2024 | 4.11 | 4.52 | 3.59 |
| 24.03.2024 | 3.89 | 3.99 | 3.79 |
| 23.03.2024 | 3.83 | 4.3 | 2.67 |
| 22.03.2024 | 4.47 | 6.64 | 3.69 |
© Bayerisches Landesamt für Umwelt 2024