
- Start >
- Rivers >
- Discharge >
- Oberer Main - Elbe >
- Heinersdorf >
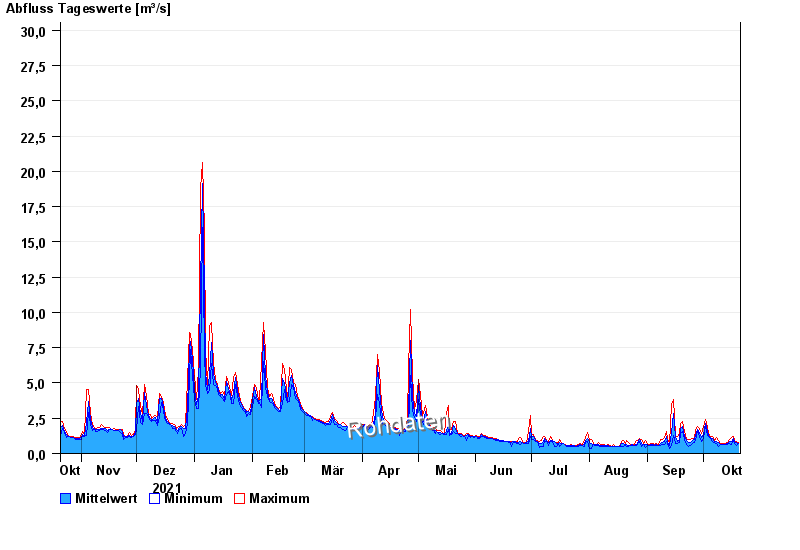
- Chart of year

Chart of year Heinersdorf / Rodach
Discharge from 21.10.2021 to 20.10.2022
- 03.01.2003 Abfluss: 86,6 m³/s
- 24.12.1967 Abfluss: 73,2 m³/s
- 08.05.2004 Abfluss: 68,3 m³/s
- 23.02.1970 Abfluss: 67,9 m³/s
- 14.01.2011 Abfluss: 67,6 m³/s
| Date | Mean value [m³/s] | Maximum [m³/s] | Minimum [m³/s] |
|---|---|---|---|
| 20.10.2022 | 0.716 | 0.759 | 0.694 |
| 19.10.2022 | 0.758 | 0.864 | 0.573 |
| 18.10.2022 | 0.806 | 0.94 | 0.726 |
| 17.10.2022 | 1.06 | 1.19 | 0.94 |
| 16.10.2022 | 0.854 | 1.1 | 0.603 |
| 15.10.2022 | 0.837 | 1.02 | 0.726 |
| 14.10.2022 | 0.714 | 0.759 | 0.662 |
© Bayerisches Landesamt für Umwelt 2024