
- Start >
- Rivers >
- Discharge >
- Oberer Main - Elbe >
- Heinersdorf >
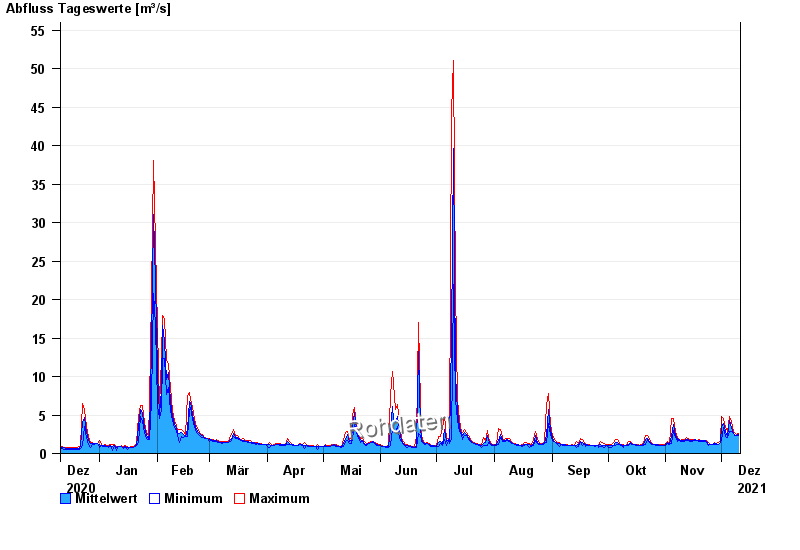
- Chart of year

Chart of year Heinersdorf / Rodach
Discharge from 11.12.2020 to 10.12.2021
| Date | Mean value [m³/s] | Maximum [m³/s] | Minimum [m³/s] |
|---|---|---|---|
| 10.12.2021 | 2.45 | 2.61 | 2.36 |
| 09.12.2021 | 2.35 | 2.49 | 2.3 |
| 08.12.2021 | 2.5 | 2.75 | 2.36 |
| 07.12.2021 | 2.66 | 2.87 | 2.55 |
| 06.12.2021 | 3.39 | 4.14 | 2.81 |
| 05.12.2021 | 4.32 | 4.87 | 2.87 |
| 04.12.2021 | 2.25 | 2.81 | 2.06 |
© Bayerisches Landesamt für Umwelt 2024