
- Start >
- Rivers >
- Discharge >
- Oberer Main - Elbe >
- Heinersdorf >
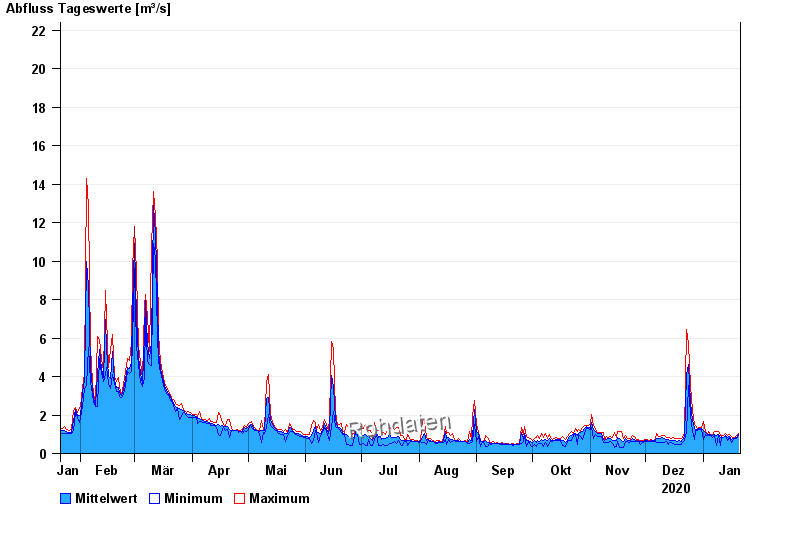
- Chart of year

Chart of year Heinersdorf / Rodach
Discharge from 21.01.2020 to 20.01.2021
- 03.01.2003 Abfluss: 86,6 m³/s
- 24.12.1967 Abfluss: 73,2 m³/s
- 08.05.2004 Abfluss: 68,3 m³/s
- 23.02.1970 Abfluss: 67,9 m³/s
- 14.01.2011 Abfluss: 67,6 m³/s
| Date | Mean value [m³/s] | Maximum [m³/s] | Minimum [m³/s] |
|---|---|---|---|
| 20.01.2021 | 0.984 | 1.03 | 0.919 |
| 19.01.2021 | 0.843 | 0.919 | 0.778 |
| 18.01.2021 | 0.795 | 0.846 | 0.778 |
| 17.01.2021 | 0.782 | 0.812 | 0.742 |
| 16.01.2021 | 0.735 | 0.884 | 0.551 |
| 15.01.2021 | 0.881 | 0.995 | 0.812 |
| 14.01.2021 | 0.838 | 0.958 | 0.676 |
© Bayerisches Landesamt für Umwelt 2024