
- Start >
- Rivers >
- Discharge >
- Oberer Main - Elbe >
- Haslach Werksabfluss >
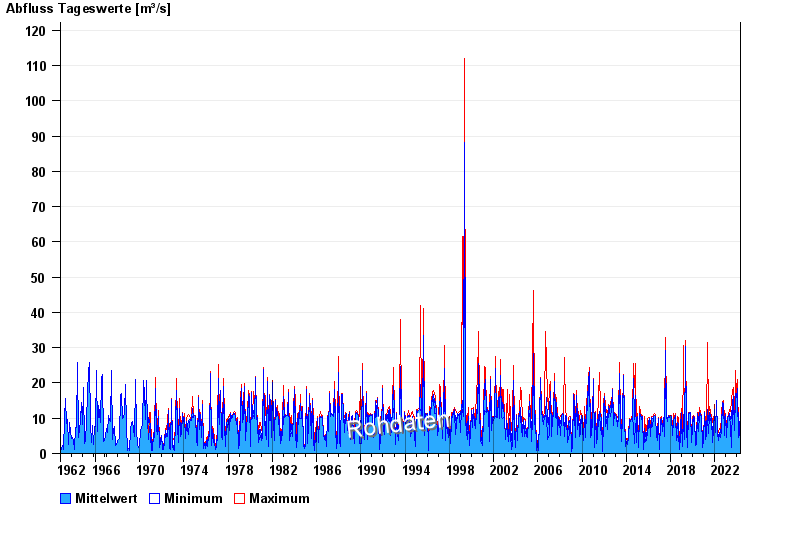
- Chart of total period

Chart of total period Haslach Werksabfluss / Wertach
Discharge from 01.11.1962 to 01.05.2024
| Date | Mean value [m³/s] | Maximum [m³/s] | Minimum [m³/s] |
|---|---|---|---|
| 01.05.2024 | 13.1 | 13.1 | 13.1 |
| 30.04.2024 | 8.38 | 13.1 | 5.6 |
| 29.04.2024 | 5.58 | 5.76 | 4.95 |
| 28.04.2024 | 5.58 | 5.76 | 5.44 |
| 27.04.2024 | 5.47 | 5.6 | 5.27 |
| 26.04.2024 | 5.35 | 5.44 | 5.27 |
| 25.04.2024 | 5.29 | 5.44 | 5.27 |
© Bayerisches Landesamt für Umwelt 2024