
- Start >
- Rivers >
- Discharge >
- Oberer Main - Elbe >
- Hammerles >
- Chart of year

Chart of year Hammerles / Schweinnaab
Discharge from 07.06.2023 to 06.06.2024
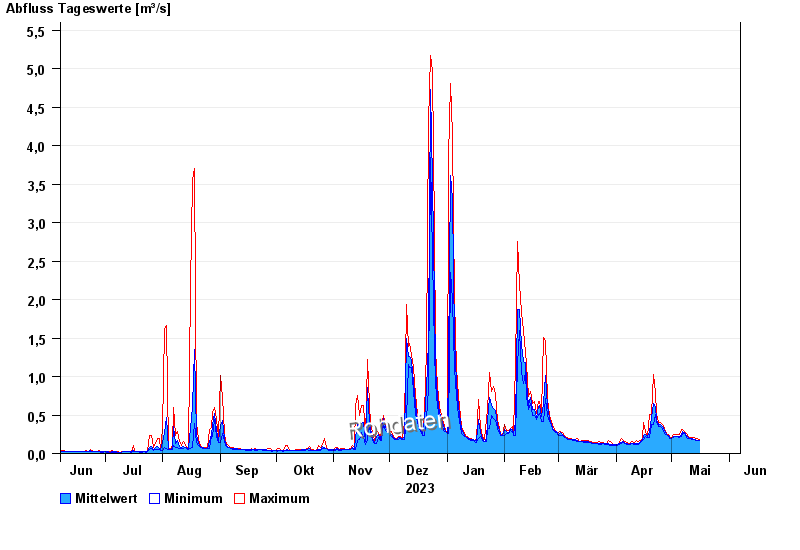
| Date | Mean value [m³/s] | Maximum [m³/s] | Minimum [m³/s] |
|---|---|---|---|
| 13.05.2024 | 0.184 | 0.208 | 0.177 |
| 12.05.2024 | 0.189 | 0.208 | 0.177 |
| 11.05.2024 | 0.198 | 0.208 | 0.191 |
| 10.05.2024 | 0.214 | 0.225 | 0.191 |
| 09.05.2024 | 0.235 | 0.263 | 0.208 |
| 08.05.2024 | 0.269 | 0.284 | 0.263 |
| 07.05.2024 | 0.285 | 0.306 | 0.263 |
© Bayerisches Landesamt für Umwelt 2024