
- Start >
- Rivers >
- Discharge >
- Oberer Main - Elbe >
- Hammerles >
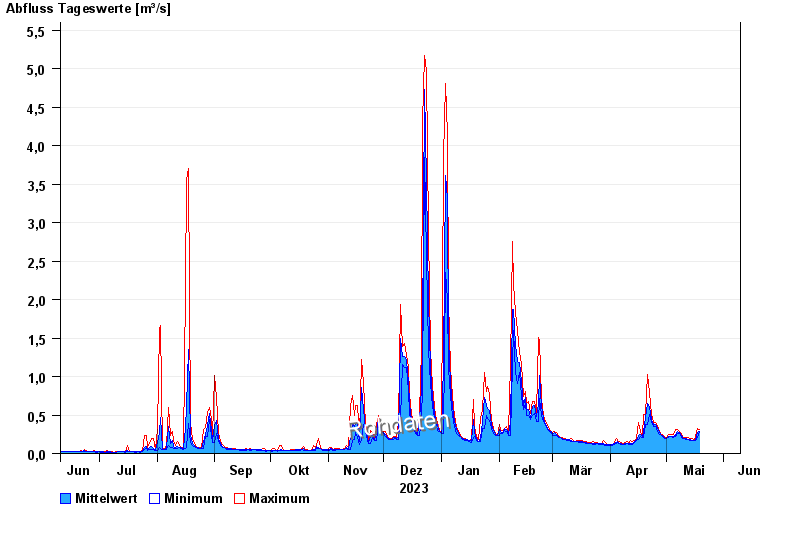
- Chart of year

Chart of year Hammerles / Schweinnaab
Discharge from 10.06.2023 to 09.06.2024
| Date | Mean value [m³/s] | Maximum [m³/s] | Minimum [m³/s] |
|---|---|---|---|
| 05.05.2024 | 0.225 | 0.243 | 0.208 |
| 04.05.2024 | 0.226 | 0.243 | 0.225 |
| 03.05.2024 | 0.225 | 0.243 | 0.225 |
| 02.05.2024 | 0.219 | 0.243 | 0.208 |
| 01.05.2024 | 0.197 | 0.208 | 0.191 |
| 30.04.2024 | 0.212 | 0.225 | 0.191 |
| 29.04.2024 | 0.231 | 0.243 | 0.225 |
© Bayerisches Landesamt für Umwelt 2024