
- Start >
- Rivers >
- Discharge >
- Oberer Main - Elbe >
- Hammerles >
- Chart of year

Chart of year Hammerles / Schweinnaab
Discharge from 01.01.2024 to 26.04.2024
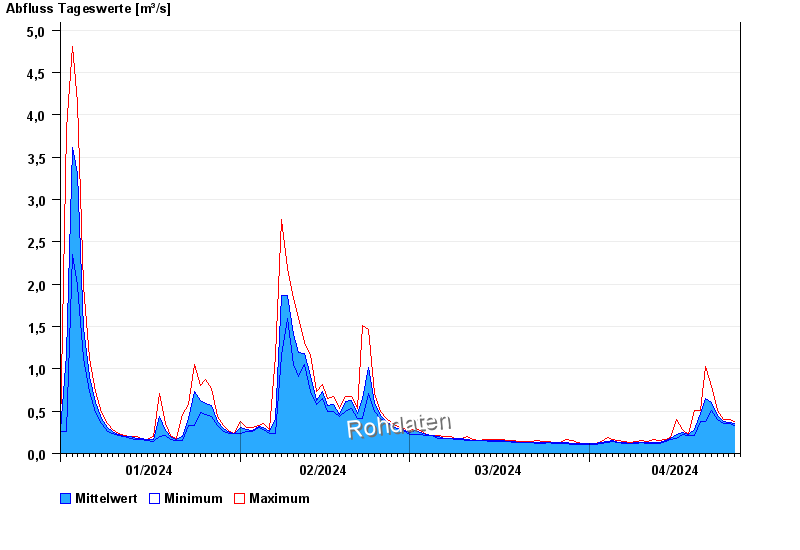
| Date | Mean value [m³/s] | Maximum [m³/s] | Minimum [m³/s] |
|---|---|---|---|
| 26.04.2024 | 0.378 | 0.378 | 0.378 |
| 25.04.2024 | 0.371 | 0.403 | 0.353 |
| 24.04.2024 | 0.38 | 0.403 | 0.353 |
| 23.04.2024 | 0.445 | 0.513 | 0.403 |
| 22.04.2024 | 0.602 | 0.792 | 0.513 |
| 21.04.2024 | 0.651 | 1.03 | 0.378 |
| 20.04.2024 | 0.469 | 0.513 | 0.378 |
© Bayerisches Landesamt für Umwelt 2024