
- Start >
- Rivers >
- Discharge >
- Oberer Main - Elbe >
- Hallerndorf >
- Chart of year

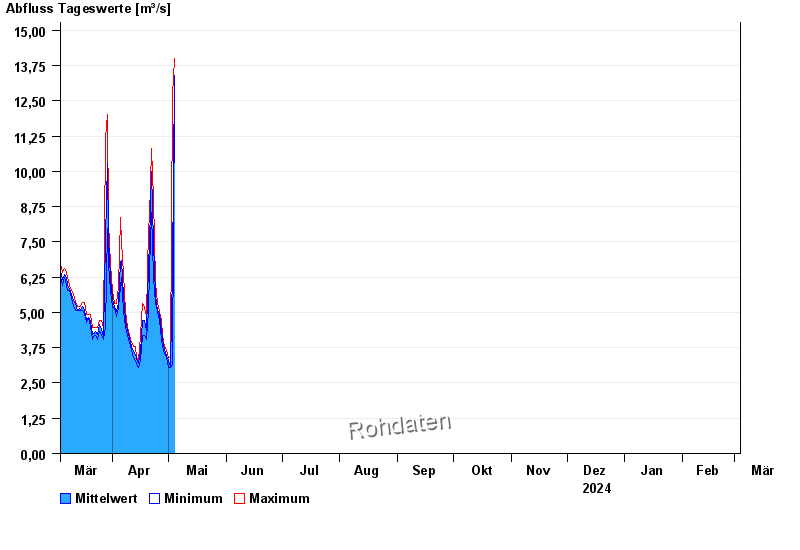
Chart of year Hallerndorf / Aisch
Discharge from 04.03.2024 to 03.03.2025
| Date | Mean value [m³/s] | Maximum [m³/s] | Minimum [m³/s] |
|---|---|---|---|
| 16.06.2024 | 3.65 | 3.78 | 3.41 |
| 15.06.2024 | 3.17 | 3.41 | 3.05 |
| 14.06.2024 | 2.98 | 3.05 | 2.93 |
| 13.06.2024 | 3.17 | 3.41 | 2.93 |
| 12.06.2024 | 3.36 | 3.66 | 3.29 |
| 11.06.2024 | 3.66 | 3.92 | 3.53 |
| 10.06.2024 | 4.27 | 4.59 | 3.92 |
© Bayerisches Landesamt für Umwelt 2024