
- Start >
- Rivers >
- Discharge >
- Oberer Main - Elbe >
- Hallerndorf >
- Chart of year

Chart of year Hallerndorf / Aisch
Discharge from 13.04.2021 to 12.04.2022
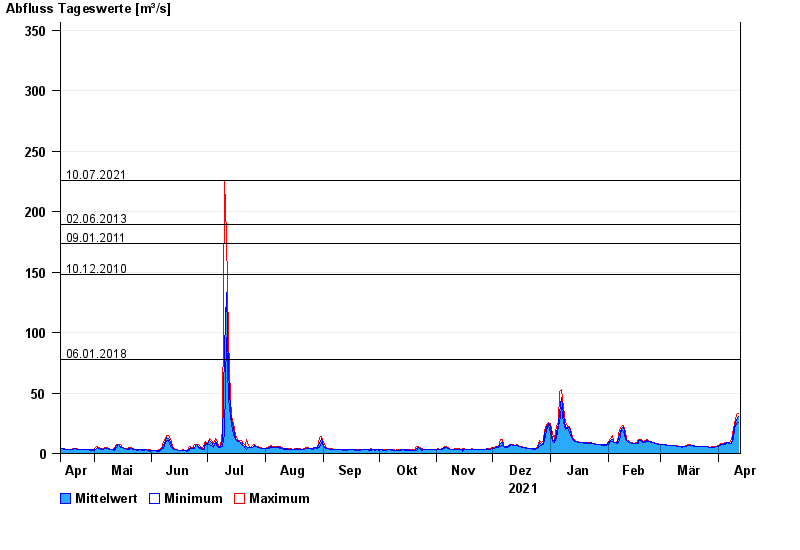
- 10.07.2021 Abfluss: 226 m³/s
- 02.06.2013 Abfluss: 189 m³/s
- 09.01.2011 Abfluss: 174 m³/s
- 10.12.2010 Abfluss: 148 m³/s
- 06.01.2018 Abfluss: 77,4 m³/s
| Date | Mean value [m³/s] | Maximum [m³/s] | Minimum [m³/s] |
|---|---|---|---|
| 12.04.2022 | 30.8 | 33.3 | 25.7 |
| 11.04.2022 | 27.8 | 32.3 | 24.4 |
| 10.04.2022 | 22 | 24.4 | 20.5 |
| 09.04.2022 | 17.3 | 20.5 | 11.2 |
| 08.04.2022 | 8.56 | 11.2 | 7.95 |
| 07.04.2022 | 8.8 | 9.12 | 8.28 |
| 06.04.2022 | 9.05 | 9.12 | 8.79 |
© Bayerisches Landesamt für Umwelt 2024