
- Start >
- Rivers >
- Discharge >
- Oberer Main - Elbe >
- Hallerndorf >
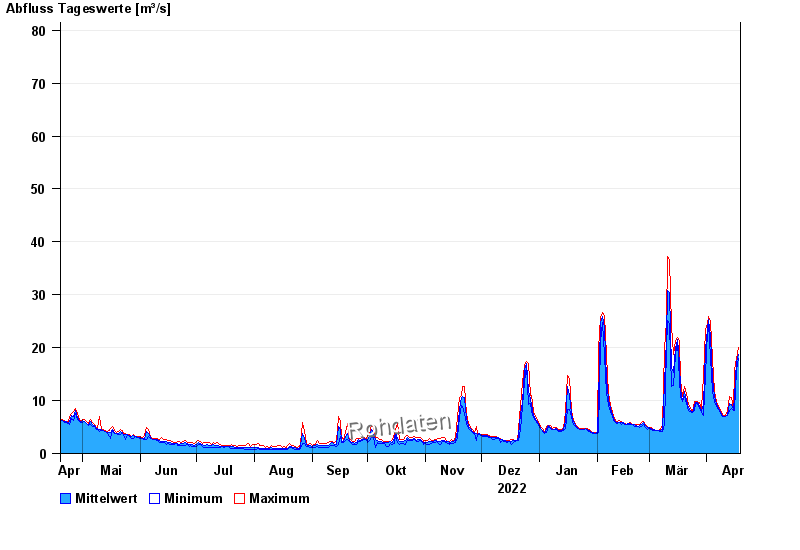
- Chart of year

Chart of year Hallerndorf / Aisch
Discharge from 19.04.2022 to 18.04.2023
 Für diesen Pegel sind keine Jährlichkeiten hinterlegt.
| Date | Mean value [m³/s] | Maximum [m³/s] | Minimum [m³/s] |
|---|---|---|---|
| 18.04.2023 | 18.8 | 20 | 17.9 |
| 17.04.2023 | 17.3 | 17.9 | 15.8 |
| 16.04.2023 | 10.6 | 15.8 | 8.06 |
| 15.04.2023 | 8.25 | 8.54 | 8.06 |
| 14.04.2023 | 9.3 | 10.5 | 8.54 |
| 13.04.2023 | 9.42 | 10.7 | 8.06 |
| 12.04.2023 | 7.36 | 8.06 | 7.09 |
© Bayerisches Landesamt für Umwelt 2024