
- Start >
- Rivers >
- Discharge >
- Oberer Main - Elbe >
- Hallerndorf >
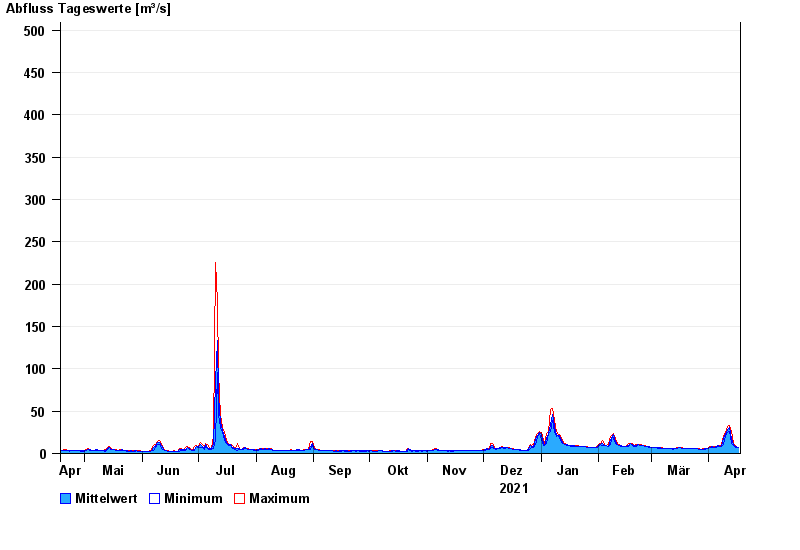
- Chart of year

Chart of year Hallerndorf / Aisch
Discharge from 18.04.2021 to 17.04.2022
 Für diesen Pegel sind keine Jährlichkeiten hinterlegt.
| Date | Mean value [m³/s] | Maximum [m³/s] | Minimum [m³/s] |
|---|---|---|---|
| 17.04.2022 | 7.09 | 7.58 | 6.78 |
| 16.04.2022 | 8.11 | 8.56 | 7.58 |
| 15.04.2022 | 9.43 | 10.1 | 8.56 |
| 14.04.2022 | 10.4 | 12.1 | 9.58 |
| 13.04.2022 | 17.3 | 25.7 | 12.1 |
| 12.04.2022 | 30.8 | 33.3 | 25.7 |
| 11.04.2022 | 27.8 | 32.3 | 24.4 |
© Bayerisches Landesamt für Umwelt 2024