
- Start >
- Rivers >
- Discharge >
- Oberer Main - Elbe >
- Grafenwöhr >
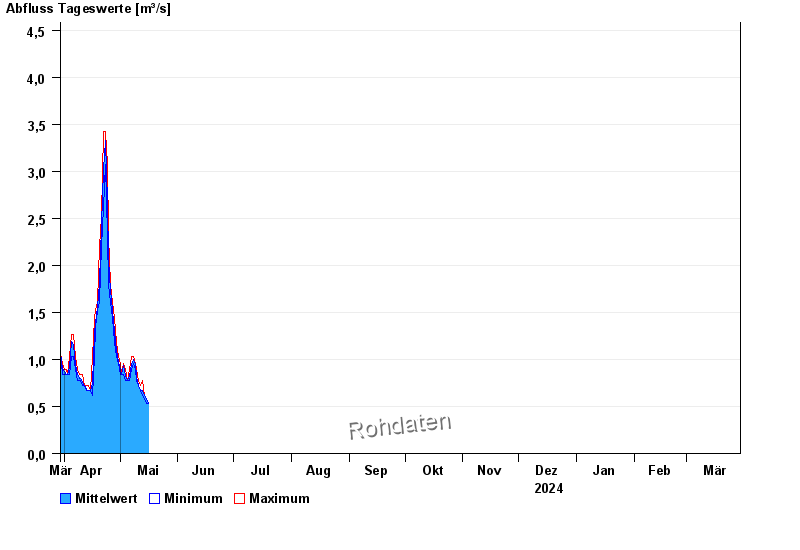
- Chart of year

Chart of year Grafenwöhr / Creußen
Discharge from 30.03.2024 to 29.03.2025
- 26.01.1995 Abfluss: 37,4 m³/s
- 14.01.2011 Abfluss: 36,3 m³/s
- 06.06.1984 Abfluss: 36,2 m³/s
- 03.01.2003 Abfluss: 35,6 m³/s
- 21.12.1993 Abfluss: 34,2 m³/s
| Date | Mean value [m³/s] | Maximum [m³/s] | Minimum [m³/s] |
|---|---|---|---|
| 15.05.2024 | 0.574 | 0.574 | 0.574 |
| 14.05.2024 | 0.616 | 0.619 | 0.574 |
| 13.05.2024 | 0.674 | 0.777 | 0.619 |
| 12.05.2024 | 0.672 | 0.723 | 0.67 |
| 11.05.2024 | 0.727 | 0.777 | 0.723 |
| 10.05.2024 | 0.816 | 0.896 | 0.777 |
| 09.05.2024 | 0.941 | 0.961 | 0.896 |
© Bayerisches Landesamt für Umwelt 2024