
- Start >
- Rivers >
- Discharge >
- Oberer Main - Elbe >
- Grafenwöhr >
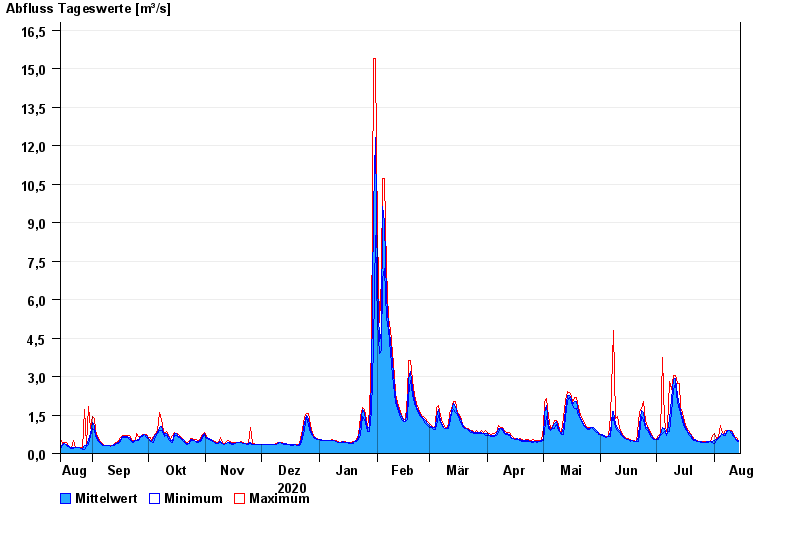
- Chart of year

Chart of year Grafenwöhr / Creußen
Discharge from 15.08.2020 to 14.08.2021
| Date | Mean value [m³/s] | Maximum [m³/s] | Minimum [m³/s] |
|---|---|---|---|
| 14.08.2021 | 0.504 | 0.525 | 0.483 |
| 13.08.2021 | 0.55 | 0.615 | 0.525 |
| 12.08.2021 | 0.627 | 0.664 | 0.615 |
| 11.08.2021 | 0.717 | 0.771 | 0.664 |
| 10.08.2021 | 0.839 | 0.89 | 0.771 |
| 09.08.2021 | 0.89 | 0.89 | 0.89 |
| 08.08.2021 | 0.89 | 0.89 | 0.889 |
© Bayerisches Landesamt für Umwelt 2024