
- Start >
- Rivers >
- Discharge >
- Oberer Main - Elbe >
- Grafenwöhr >
- Chart of year

Chart of year Grafenwöhr / Creußen
Discharge from 01.01.2019 to 31.12.2019
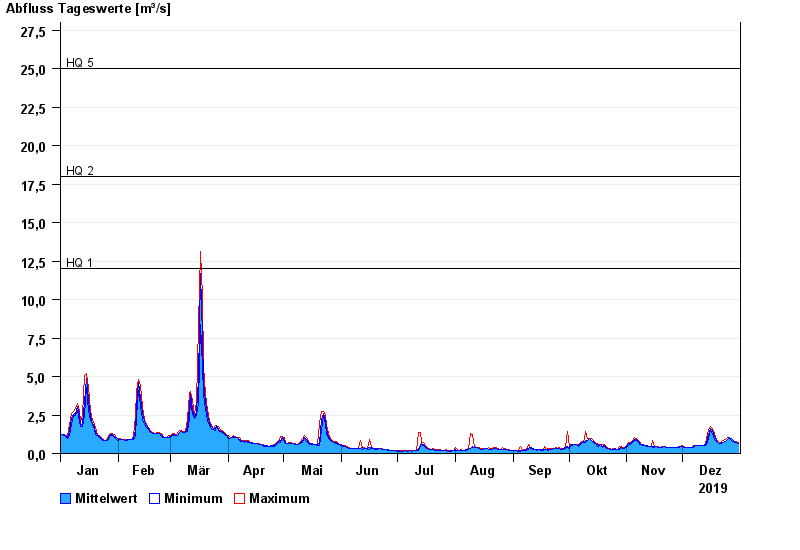
- HQ1 12 m³/s
- HQ2 18 m³/s
- HQ5 25 m³/s
- HQ10 31 m³/s
- HQ20 36 m³/s
- HQ50 43 m³/s
- HQ100 49 m³/s
| Date | Mean value [m³/s] | Maximum [m³/s] | Minimum [m³/s] |
|---|---|---|---|
| 31.12.2019 | 0.66 | 0.698 | 0.646 |
| 30.12.2019 | 0.709 | 0.791 | 0.688 |
| 29.12.2019 | 0.772 | 0.79 | 0.729 |
| 28.12.2019 | 0.825 | 0.877 | 0.775 |
| 27.12.2019 | 0.945 | 0.983 | 0.874 |
| 26.12.2019 | 1.01 | 1.03 | 0.973 |
| 25.12.2019 | 0.935 | 1.02 | 0.886 |
© Bayerisches Landesamt für Umwelt 2024