
- Start >
- Rivers >
- Discharge >
- Oberer Main - Elbe >
- Grafenwöhr >
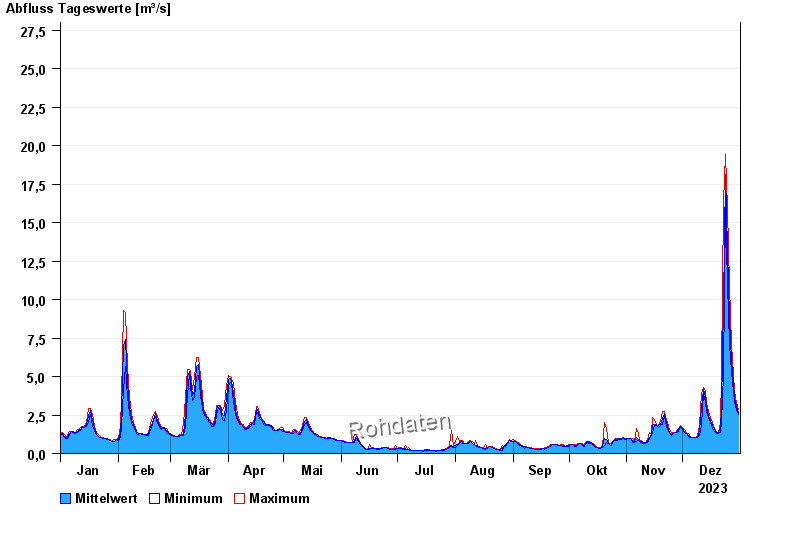
- Chart of year

Chart of year Grafenwöhr / Creußen
Discharge from 01.01.2023 to 31.12.2023
- 26.01.1995 Abfluss: 37,4 m³/s
- 14.01.2011 Abfluss: 36,3 m³/s
- 06.06.1984 Abfluss: 36,2 m³/s
- 03.01.2003 Abfluss: 35,6 m³/s
- 21.12.1993 Abfluss: 34,2 m³/s
| Date | Mean value [m³/s] | Maximum [m³/s] | Minimum [m³/s] |
|---|---|---|---|
| 31.12.2023 | 2.69 | 2.85 | 2.52 |
| 30.12.2023 | 3.03 | 3.31 | 2.85 |
| 29.12.2023 | 3.61 | 4.02 | 3.31 |
| 28.12.2023 | 4.56 | 5.13 | 4.02 |
| 27.12.2023 | 6.01 | 7.09 | 5.25 |
| 26.12.2023 | 8.79 | 10.9 | 7.09 |
| 25.12.2023 | 13.2 | 15.9 | 11 |
© Bayerisches Landesamt für Umwelt 2024