
- Start >
- Rivers >
- Discharge >
- Oberer Main - Elbe >
- Grafenwöhr >
- Chart of total period

Chart of total period Grafenwöhr / Creußen
Discharge from 01.11.1957 to 27.04.2024
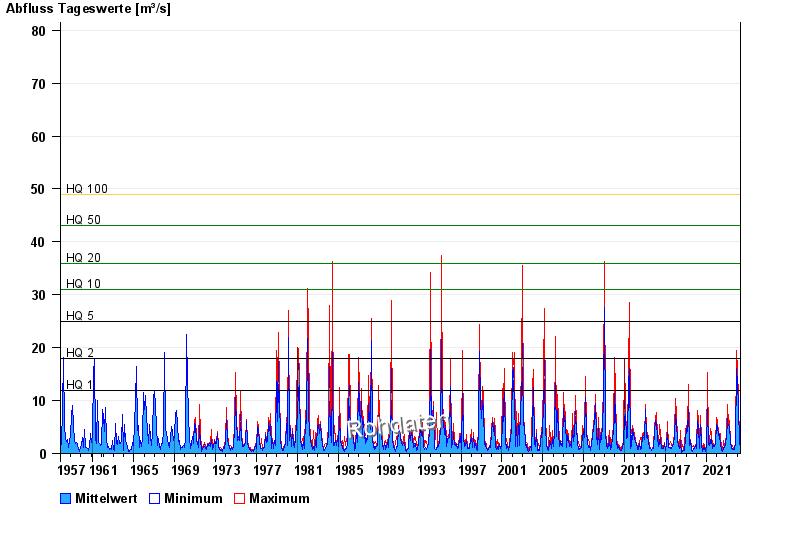
- HQ1 12 m³/s
- HQ2 18 m³/s
- HQ5 25 m³/s
- HQ10 31 m³/s
- HQ20 36 m³/s
- HQ50 43 m³/s
- HQ100 49 m³/s
| Date | Mean value [m³/s] | Maximum [m³/s] | Minimum [m³/s] |
|---|---|---|---|
| 27.04.2024 | 1.53 | 1.61 | 1.43 |
| 26.04.2024 | 1.73 | 1.8 | 1.61 |
| 25.04.2024 | 2.06 | 2.31 | 1.8 |
| 24.04.2024 | 2.67 | 3.07 | 2.31 |
| 23.04.2024 | 3.33 | 3.42 | 3.07 |
| 22.04.2024 | 3.02 | 3.42 | 2.62 |
| 21.04.2024 | 2.42 | 2.52 | 2.2 |
© Bayerisches Landesamt für Umwelt 2024