
- Start >
- Rivers >
- Discharge >
- Oberer Main - Elbe >
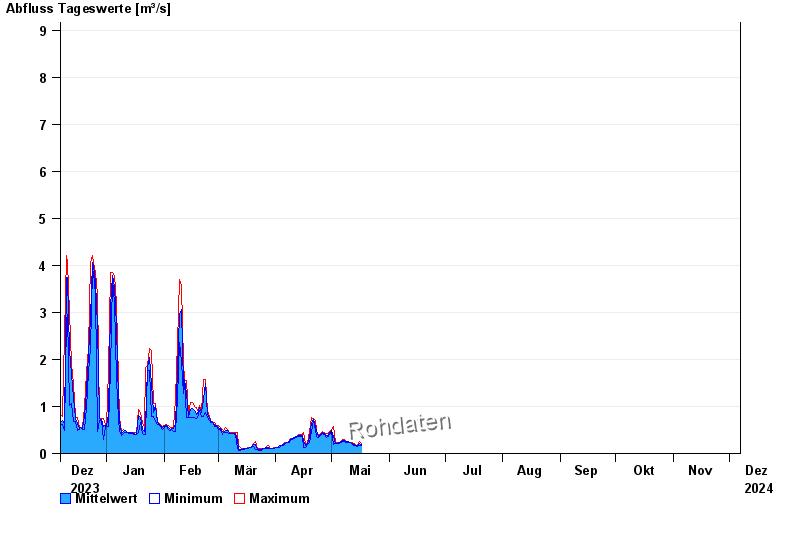
- Goldbergsee Ablauf >
- Chart of year

Chart of year Goldbergsee Ablauf / Sulzbach
Discharge from 07.12.2023 to 06.12.2024
 Für diesen Pegel sind keine Jährlichkeiten hinterlegt.
note
Beeinflussung des Abflusses aufgrund Hindernisse im Unterlauf.
| Date | Mean value [m³/s] | Maximum [m³/s] | Minimum [m³/s] |
|---|---|---|---|
| 03.05.2024 | 0.214 | 0.228 | 0.211 |
| 02.05.2024 | 0.365 | 0.571 | 0.195 |
| 01.05.2024 | 0.499 | 0.519 | 0.47 |
| 30.04.2024 | 0.442 | 0.47 | 0.401 |
| 29.04.2024 | 0.376 | 0.424 | 0.359 |
| 28.04.2024 | 0.386 | 0.424 | 0.338 |
| 27.04.2024 | 0.428 | 0.446 | 0.401 |
© Bayerisches Landesamt für Umwelt 2024