
- Start >
- Rivers >
- Discharge >
- Oberer Main - Elbe >
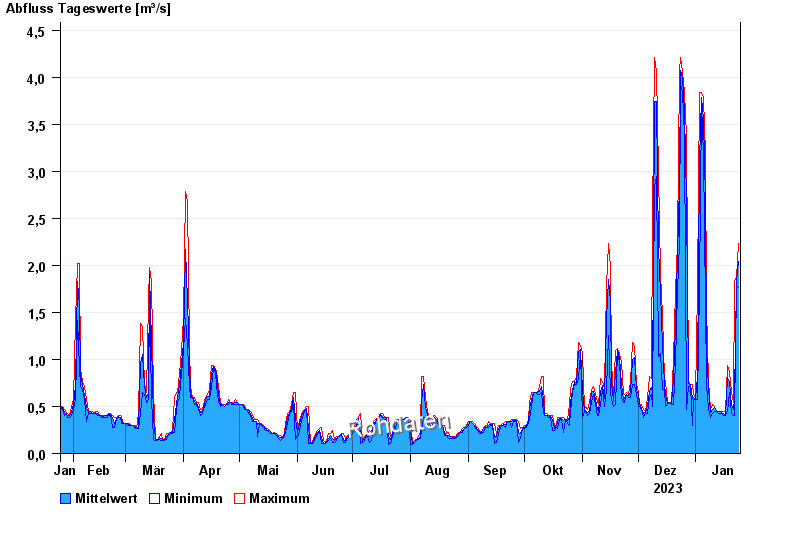
- Goldbergsee Ablauf >
- Chart of year

Chart of year Goldbergsee Ablauf / Sulzbach
Discharge from 25.01.2023 to 24.01.2024
note
Beeinflussung des Abflusses aufgrund Hindernisse im Unterlauf.
| Date | Mean value [m³/s] | Maximum [m³/s] | Minimum [m³/s] |
|---|---|---|---|
| 24.01.2024 | 2.04 | 2.23 | 1.76 |
| 23.01.2024 | 1.83 | 1.87 | 1.79 |
| 22.01.2024 | 0.587 | 1.83 | 0.401 |
| 21.01.2024 | 0.466 | 0.545 | 0.401 |
| 20.01.2024 | 0.513 | 0.651 | 0.424 |
| 19.01.2024 | 0.756 | 0.877 | 0.651 |
| 18.01.2024 | 0.803 | 0.935 | 0.446 |
© Bayerisches Landesamt für Umwelt 2024