
- Start >
- Rivers >
- Discharge >
- Oberer Main - Elbe >
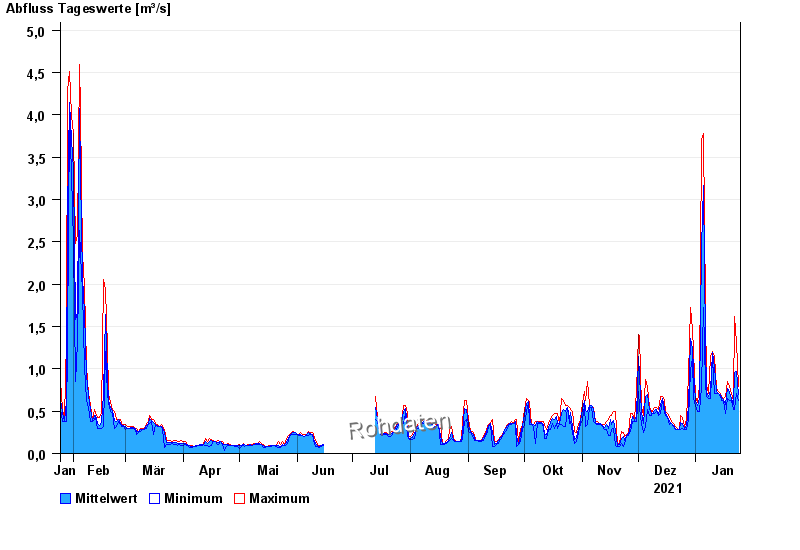
- Goldbergsee Ablauf >
- Chart of year

Chart of year Goldbergsee Ablauf / Sulzbach
Discharge from 25.01.2021 to 24.01.2022
note
Beeinflussung des Abflusses aufgrund Hindernisse im Unterlauf.
| Date | Mean value [m³/s] | Maximum [m³/s] | Minimum [m³/s] |
|---|---|---|---|
| 24.01.2022 | 0.701 | 0.792 | 0.624 |
| 23.01.2022 | 0.967 | 1.31 | 0.707 |
| 22.01.2022 | 0.953 | 1.62 | 0.519 |
| 21.01.2022 | 0.575 | 0.624 | 0.519 |
| 20.01.2022 | 0.648 | 0.707 | 0.624 |
| 19.01.2022 | 0.722 | 0.792 | 0.624 |
| 18.01.2022 | 0.772 | 0.849 | 0.651 |
© Bayerisches Landesamt für Umwelt 2024