
- Start >
- Rivers >
- Discharge >
- Oberer Main - Elbe >
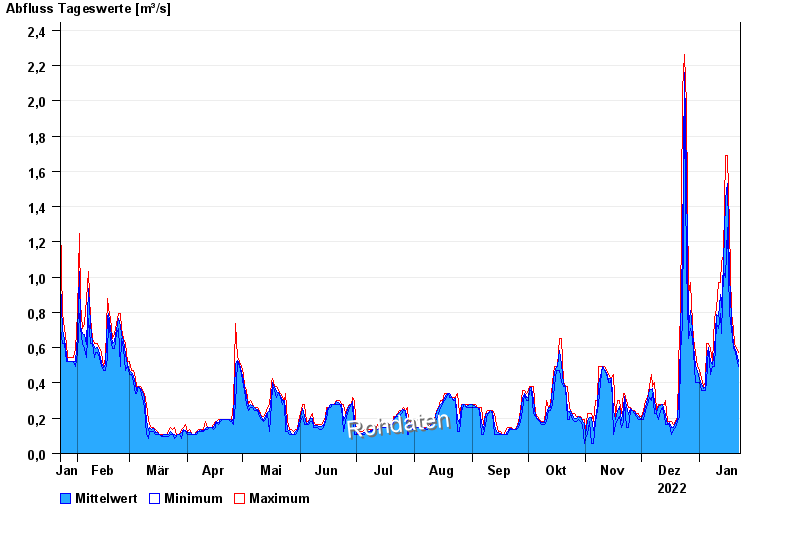
- Goldbergsee Ablauf >
- Chart of year

Chart of year Goldbergsee Ablauf / Sulzbach
Discharge from 23.01.2022 to 22.01.2023
note
Beeinflussung des Abflusses aufgrund Hindernisse im Unterlauf.
| Date | Mean value [m³/s] | Maximum [m³/s] | Minimum [m³/s] |
|---|---|---|---|
| 22.01.2023 | 0.521 | 0.571 | 0.495 |
| 21.01.2023 | 0.575 | 0.597 | 0.545 |
| 20.01.2023 | 0.6 | 0.624 | 0.597 |
| 19.01.2023 | 0.614 | 0.707 | 0.597 |
| 18.01.2023 | 0.76 | 0.792 | 0.707 |
| 17.01.2023 | 1.01 | 1.28 | 0.792 |
| 16.01.2023 | 1.53 | 1.69 | 1.28 |
© Bayerisches Landesamt für Umwelt 2024