
- Start >
- Rivers >
- Discharge >
- Oberer Main - Elbe >
- Goldbergsee Ablauf >
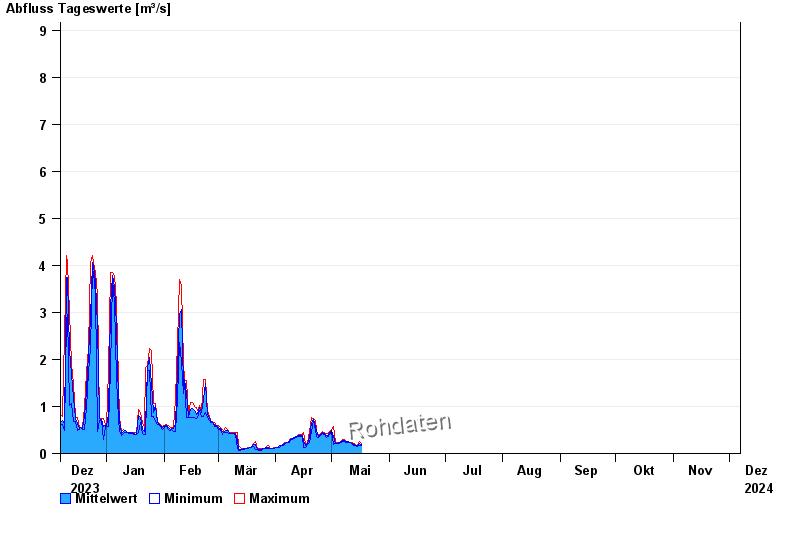
- Chart of year

Chart of year Goldbergsee Ablauf / Sulzbach
Discharge from 07.12.2023 to 06.12.2024
 Für diesen Pegel sind keine Jährlichkeiten hinterlegt.
note
Beeinflussung des Abflusses aufgrund Hindernisse im Unterlauf.
| Date | Mean value [m³/s] | Maximum [m³/s] | Minimum [m³/s] |
|---|---|---|---|
| 19.06.2024 | 0.735 | 0.735 | 0.735 |
| 18.06.2024 | 0.733 | 0.735 | 0.707 |
| 17.06.2024 | 0.684 | 0.735 | 0.651 |
| 16.06.2024 | 0.638 | 0.651 | 0.624 |
| 15.06.2024 | 0.607 | 0.651 | 0.545 |
| 14.06.2024 | 0.497 | 0.545 | 0.38 |
| 13.06.2024 | 0.356 | 0.38 | 0.299 |
© Bayerisches Landesamt für Umwelt 2024