
- Start >
- Rivers >
- Discharge >
- Oberer Main - Elbe >
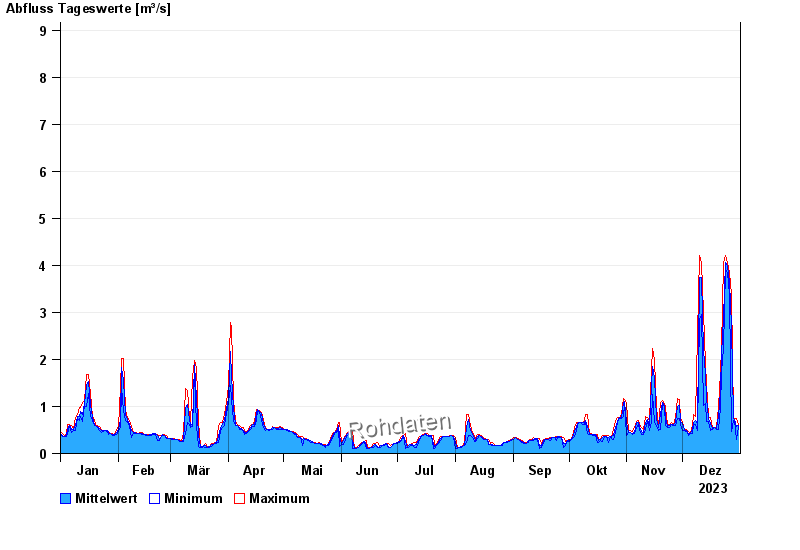
- Goldbergsee Ablauf >
- Chart of year

Chart of year Goldbergsee Ablauf / Sulzbach
Discharge from 01.01.2023 to 31.12.2023
 Für diesen Pegel sind keine Jährlichkeiten hinterlegt.
note
Beeinflussung des Abflusses aufgrund Hindernisse im Unterlauf.
| Date | Mean value [m³/s] | Maximum [m³/s] | Minimum [m³/s] |
|---|---|---|---|
| 31.12.2023 | 0.597 | 0.624 | 0.571 |
| 30.12.2023 | 0.58 | 0.735 | 0.299 |
| 29.12.2023 | 0.729 | 0.735 | 0.707 |
| 28.12.2023 | 0.747 | 0.764 | 0.707 |
| 27.12.2023 | 2.69 | 3.38 | 0.47 |
| 26.12.2023 | 3.64 | 3.84 | 3.38 |
| 25.12.2023 | 4 | 4.06 | 3.84 |
© Bayerisches Landesamt für Umwelt 2024