
- Start >
- Rivers >
- Discharge >
- Oberer Main - Elbe >
- Geschwend >
- Chart of year

Chart of year Geschwend / Kremnitz
Discharge from 24.10.2021 to 23.10.2022
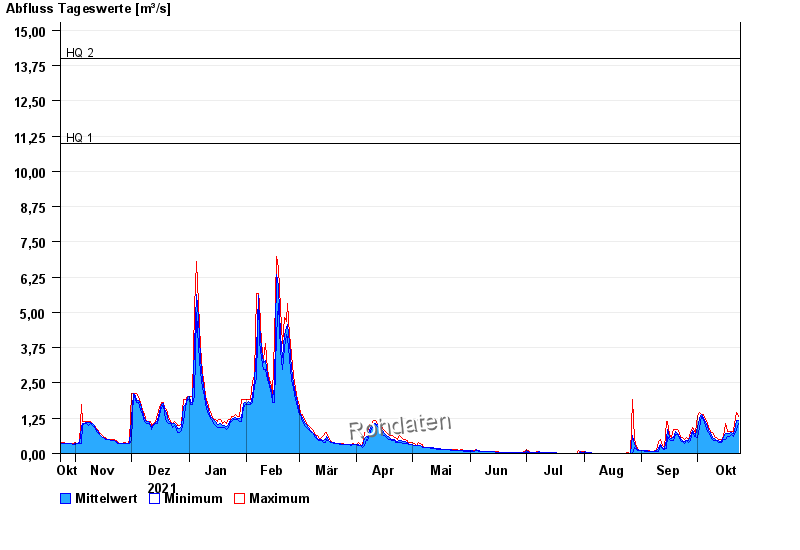
- HQ1 11 m³/s
- HQ2 14 m³/s
- HQ5 19,5 m³/s
- HQ10 25 m³/s
- HQ20 31 m³/s
- HQ50 40 m³/s
- HQ100 48 m³/s
| Date | Mean value [m³/s] | Maximum [m³/s] | Minimum [m³/s] |
|---|---|---|---|
| 23.10.2022 | 1.17 | 1.3 | 1.07 |
| 22.10.2022 | 1.18 | 1.47 | 0.865 |
| 21.10.2022 | 0.806 | 1.07 | 0.672 |
| 20.10.2022 | 0.707 | 0.796 | 0.612 |
| 19.10.2022 | 0.728 | 0.796 | 0.672 |
| 18.10.2022 | 0.692 | 0.796 | 0.612 |
| 17.10.2022 | 0.723 | 0.796 | 0.612 |
© Bayerisches Landesamt für Umwelt 2024