
- Start >
- Rivers >
- Discharge >
- Oberer Main - Elbe >
- Geschwend >
- Chart of year

Chart of year Geschwend / Kremnitz
Discharge from 01.01.2024 to 31.12.2024
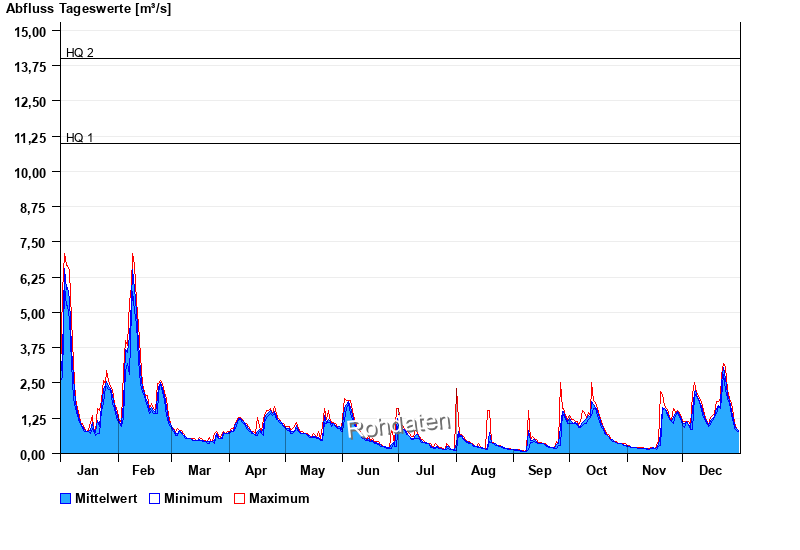
- HQ1 11 m³/s
- HQ2 14 m³/s
- HQ5 19,5 m³/s
- HQ10 25 m³/s
- HQ20 31 m³/s
- HQ50 40 m³/s
- HQ100 48 m³/s
| Date | Mean value [m³/s] | Maximum [m³/s] | Minimum [m³/s] |
|---|---|---|---|
| 31.12.2024 | 0.81 | 0.831 | 0.766 |
| 30.12.2024 | 0.893 | 0.894 | 0.831 |
| 29.12.2024 | 0.996 | 1.11 | 0.894 |
| 28.12.2024 | 1.21 | 1.33 | 1.11 |
| 27.12.2024 | 1.53 | 1.77 | 1.33 |
| 26.12.2024 | 1.87 | 1.96 | 1.77 |
| 25.12.2024 | 2.1 | 2.26 | 1.96 |
© Bayerisches Landesamt für Umwelt 2025