
- Start >
- Rivers >
- Discharge >
- Oberer Main - Elbe >
- Geschwend >
- Chart of total period

Chart of total period Geschwend / Kremnitz
Discharge from 01.11.1964 to 08.05.2024
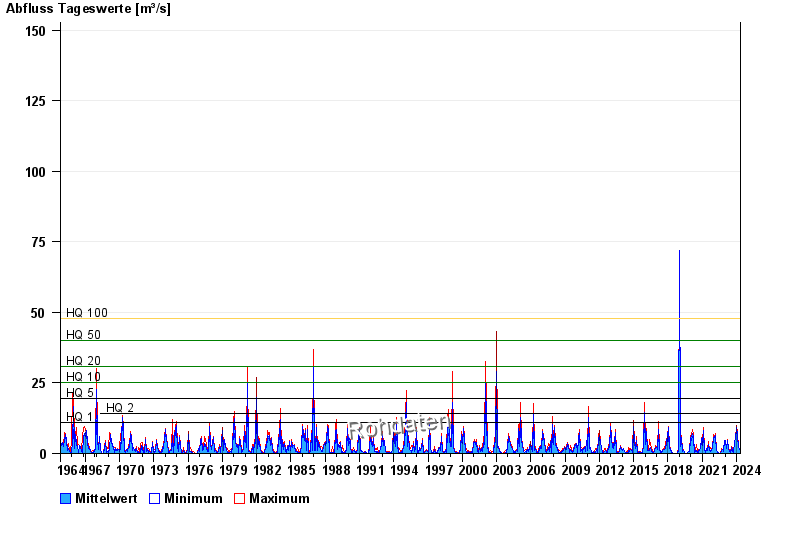
- HQ1 11 m³/s
- HQ2 14 m³/s
- HQ5 19,5 m³/s
- HQ10 25 m³/s
- HQ20 31 m³/s
- HQ50 40 m³/s
- HQ100 48 m³/s
| Date | Mean value [m³/s] | Maximum [m³/s] | Minimum [m³/s] |
|---|---|---|---|
| 08.05.2024 | 0.835 | 0.902 | 0.769 |
| 07.05.2024 | 0.979 | 1.11 | 0.902 |
| 06.05.2024 | 0.782 | 0.973 | 0.769 |
| 05.05.2024 | 0.783 | 0.902 | 0.705 |
| 04.05.2024 | 0.774 | 0.832 | 0.705 |
| 03.05.2024 | 0.887 | 0.973 | 0.832 |
| 02.05.2024 | 0.9 | 0.973 | 0.832 |
© Bayerisches Landesamt für Umwelt 2024