
- Start >
- Rivers >
- Discharge >
- Oberer Main - Elbe >
- Gampelmühle >
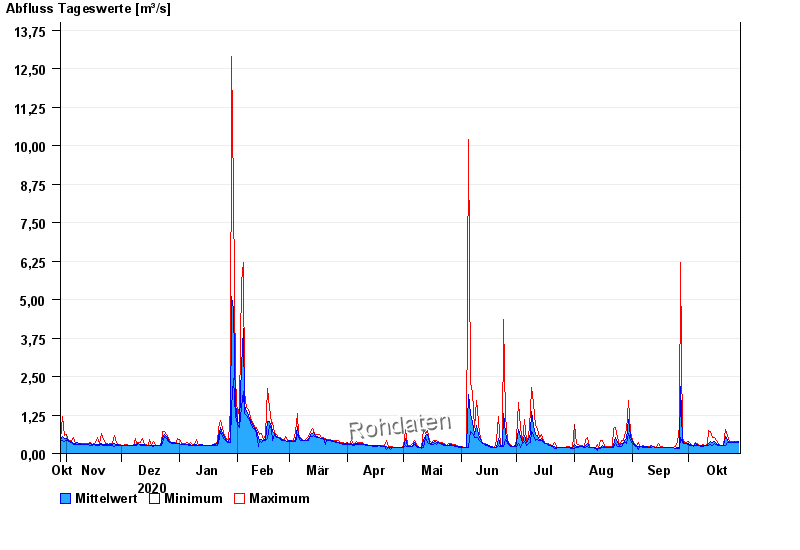
- Chart of year

Chart of year Gampelmühle / Ölschnitz
Discharge from 29.10.2020 to 28.10.2021
| Date | Mean value [m³/s] | Maximum [m³/s] | Minimum [m³/s] |
|---|---|---|---|
| 28.10.2021 | 0.374 | 0.393 | 0.371 |
| 27.10.2021 | 0.373 | 0.393 | 0.371 |
| 26.10.2021 | 0.383 | 0.393 | 0.371 |
| 25.10.2021 | 0.368 | 0.393 | 0.351 |
| 24.10.2021 | 0.369 | 0.393 | 0.351 |
| 23.10.2021 | 0.372 | 0.393 | 0.351 |
| 22.10.2021 | 0.432 | 0.581 | 0.371 |
© Bayerisches Landesamt für Umwelt 2024