
- Start >
- Rivers >
- Discharge >
- Oberer Main - Elbe >
- Gampelmühle >
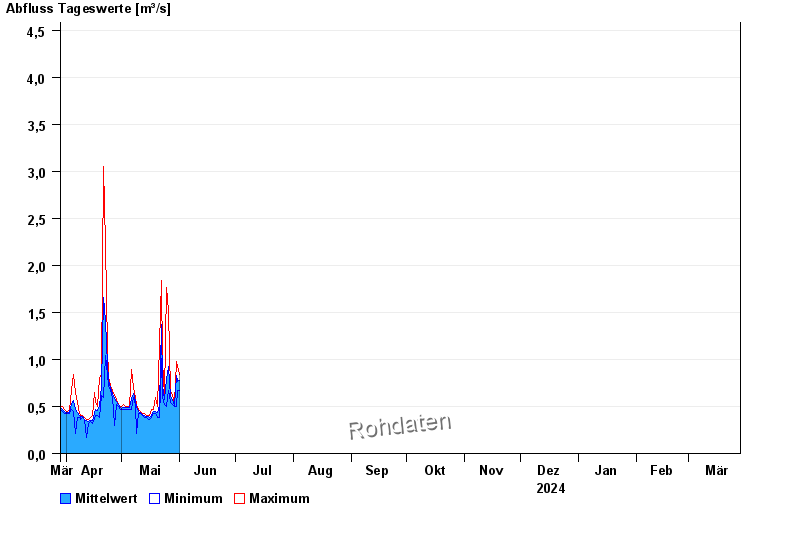
- Chart of year

Chart of year Gampelmühle / Ölschnitz
Discharge from 29.03.2024 to 28.03.2025
- 06.06.1984 Abfluss: 25,5 m³/s
- 16.08.1972 Abfluss: 20,4 m³/s
- 23.02.1970 Abfluss: 19,8 m³/s
- 26.01.1995 Abfluss: 19,7 m³/s
- 28.05.2006 Abfluss: 18,5 m³/s
| Date | Mean value [m³/s] | Maximum [m³/s] | Minimum [m³/s] |
|---|---|---|---|
| 09.05.2024 | 0.487 | 0.521 | 0.215 |
| 08.05.2024 | 0.552 | 0.594 | 0.521 |
| 07.05.2024 | 0.641 | 0.699 | 0.594 |
| 06.05.2024 | 0.588 | 0.895 | 0.472 |
| 05.05.2024 | 0.486 | 0.497 | 0.472 |
| 04.05.2024 | 0.486 | 0.497 | 0.472 |
| 03.05.2024 | 0.494 | 0.497 | 0.472 |
© Bayerisches Landesamt für Umwelt 2024