
- Start >
- Rivers >
- Discharge >
- Oberer Main - Elbe >
- Gampelmühle >
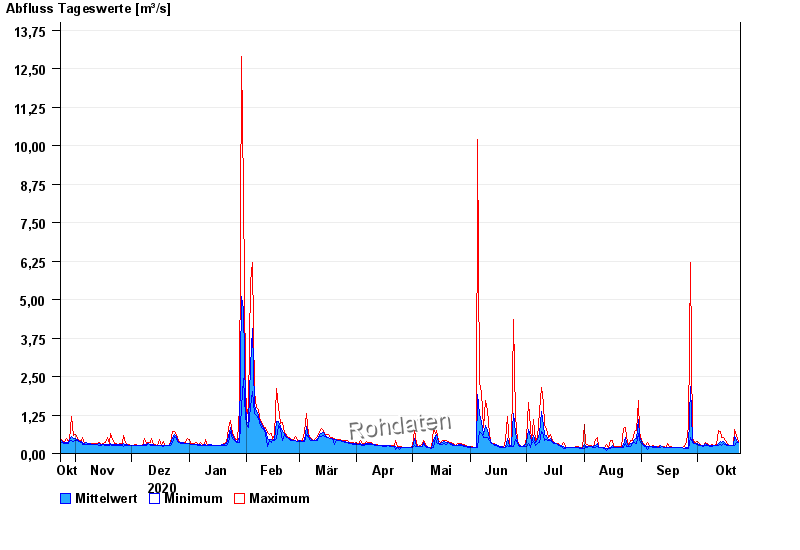
- Chart of year

Chart of year Gampelmühle / Ölschnitz
Discharge from 24.10.2020 to 23.10.2021
| Date | Mean value [m³/s] | Maximum [m³/s] | Minimum [m³/s] |
|---|---|---|---|
| 23.10.2021 | 0.372 | 0.393 | 0.351 |
| 22.10.2021 | 0.432 | 0.581 | 0.371 |
| 21.10.2021 | 0.567 | 0.794 | 0.273 |
| 20.10.2021 | 0.266 | 0.273 | 0.256 |
| 19.10.2021 | 0.265 | 0.273 | 0.256 |
| 18.10.2021 | 0.269 | 0.273 | 0.256 |
| 17.10.2021 | 0.294 | 0.311 | 0.273 |
© Bayerisches Landesamt für Umwelt 2024