
- Start >
- Rivers >
- Discharge >
- Oberer Main - Elbe >
- Gampelmühle >
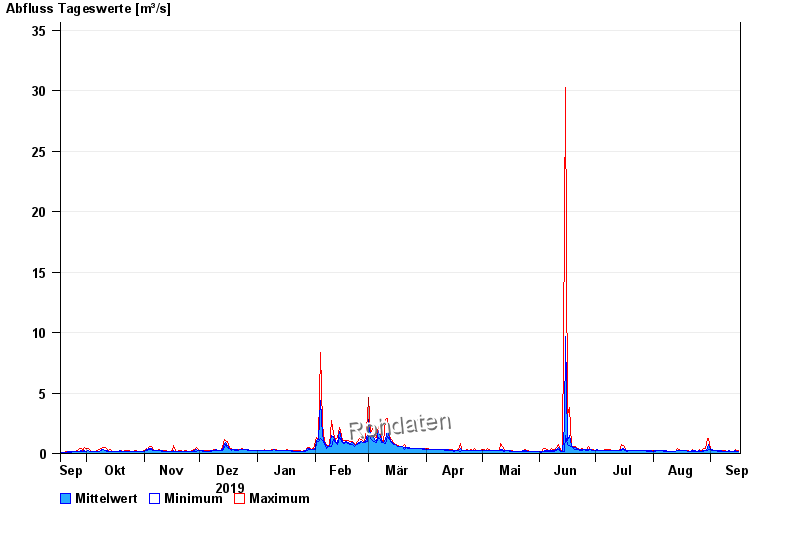
- Chart of year

Chart of year Gampelmühle / Ölschnitz
Discharge from 17.09.2019 to 16.09.2020
| Date | Mean value [m³/s] | Maximum [m³/s] | Minimum [m³/s] |
|---|---|---|---|
| 16.09.2020 | 0.2 | 0.219 | 0.192 |
| 15.09.2020 | 0.202 | 0.219 | 0.192 |
| 14.09.2020 | 0.217 | 0.32 | 0.192 |
| 13.09.2020 | 0.204 | 0.205 | 0.192 |
| 12.09.2020 | 0.204 | 0.205 | 0.192 |
| 11.09.2020 | 0.209 | 0.234 | 0.205 |
| 10.09.2020 | 0.205 | 0.205 | 0.192 |
© Bayerisches Landesamt für Umwelt 2024