
- Start >
- Rivers >
- Discharge >
- Oberer Main - Elbe >
- Gampelmühle >
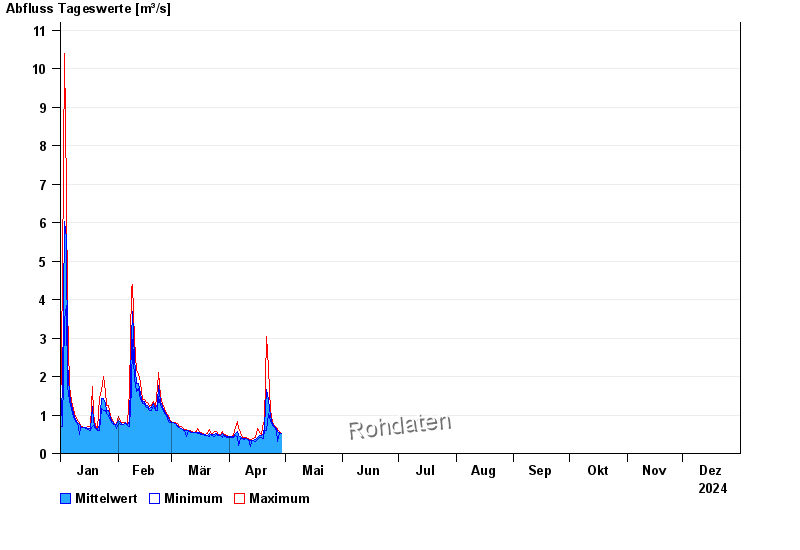
- Chart of year

Chart of year Gampelmühle / Ölschnitz
Discharge from 01.01.2024 to 31.12.2024
| Date | Mean value [m³/s] | Maximum [m³/s] | Minimum [m³/s] |
|---|---|---|---|
| 23.05.2024 | 0.764 | 0.981 | 0.62 |
| 22.05.2024 | 1.37 | 1.84 | 1.01 |
| 21.05.2024 | 0.515 | 1.16 | 0.384 |
| 20.05.2024 | 0.431 | 0.497 | 0.384 |
| 19.05.2024 | 0.451 | 0.594 | 0.427 |
| 18.05.2024 | 0.445 | 0.472 | 0.427 |
| 17.05.2024 | 0.407 | 0.472 | 0.384 |
© Bayerisches Landesamt für Umwelt 2024