
- Start >
- Rivers >
- Discharge >
- Oberer Main - Elbe >
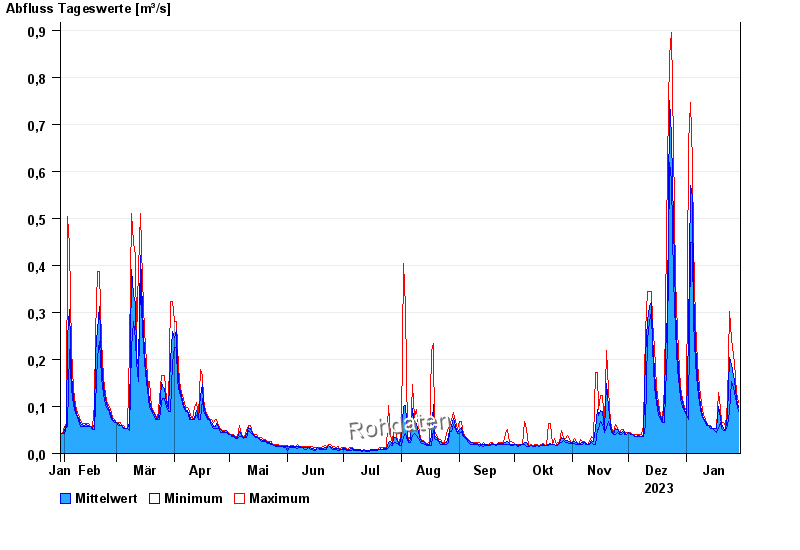
- Friedersreuth >
- Chart of year

Chart of year Friedersreuth / Schweinnaab
Discharge from 30.01.2023 to 29.01.2024
- 13.01.2011 Abfluss: 3,29 m³/s
- 23.12.2012 Abfluss: 2,05 m³/s
- 02.06.2013 Abfluss: 2,04 m³/s
- 02.08.2010 Abfluss: 1,64 m³/s
- 30.01.2013 Abfluss: 1,5 m³/s
| Date | Mean value [m³/s] | Maximum [m³/s] | Minimum [m³/s] |
|---|---|---|---|
| 29.01.2024 | 0.098 | 0.108 | 0.089 |
| 28.01.2024 | 0.118 | 0.129 | 0.108 |
| 27.01.2024 | 0.156 | 0.194 | 0.129 |
| 26.01.2024 | 0.164 | 0.209 | 0.14 |
| 25.01.2024 | 0.189 | 0.243 | 0.153 |
| 24.01.2024 | 0.205 | 0.302 | 0.089 |
| 23.01.2024 | 0.082 | 0.108 | 0.059 |
© Bayerisches Landesamt für Umwelt 2024