
- Start >
- Rivers >
- Discharge >
- Oberer Main - Elbe >
- Friedersreuth >
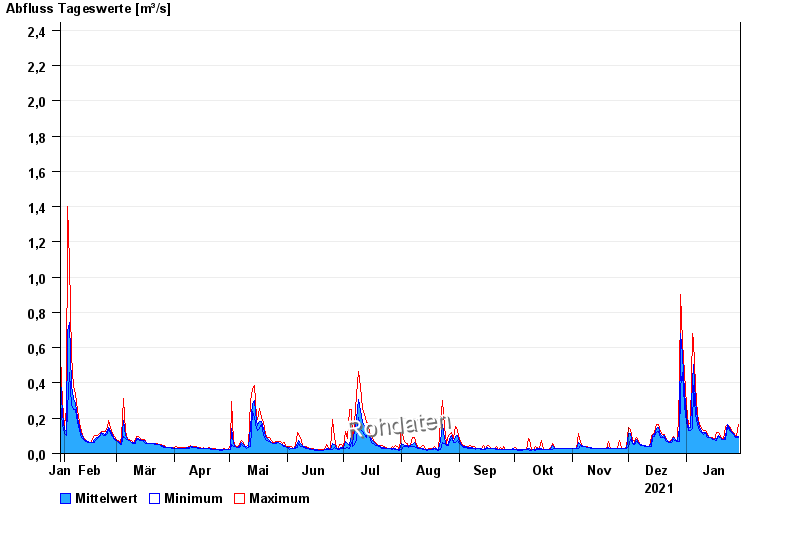
- Chart of year

Chart of year Friedersreuth / Schweinnaab
Discharge from 30.01.2021 to 29.01.2022
 Für diesen Pegel sind keine Jährlichkeiten hinterlegt.
| Date | Mean value [m³/s] | Maximum [m³/s] | Minimum [m³/s] |
|---|---|---|---|
| 29.01.2022 | 0.099 | 0.164 | 0.089 |
| 28.01.2022 | 0.095 | 0.098 | 0.089 |
| 27.01.2022 | 0.101 | 0.107 | 0.098 |
| 26.01.2022 | 0.113 | 0.117 | 0.107 |
| 25.01.2022 | 0.126 | 0.128 | 0.117 |
| 24.01.2022 | 0.141 | 0.151 | 0.128 |
| 23.01.2022 | 0.162 | 0.164 | 0.151 |
© Bayerisches Landesamt für Umwelt 2024