
- Start >
- Rivers >
- Discharge >
- Oberer Main - Elbe >
- Friedersreuth >
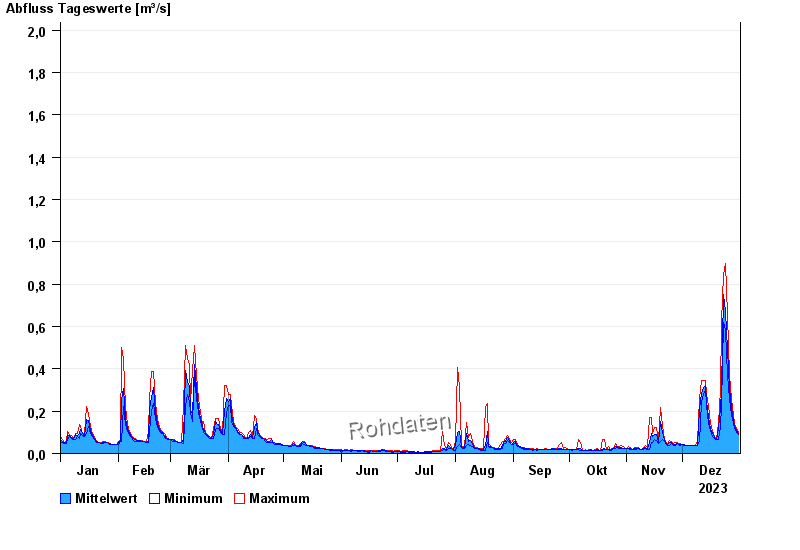
- Chart of year

Chart of year Friedersreuth / Schweinnaab
Discharge from 01.01.2023 to 31.12.2023
 Für diesen Pegel sind keine Jährlichkeiten hinterlegt.
| Date | Mean value [m³/s] | Maximum [m³/s] | Minimum [m³/s] |
|---|---|---|---|
| 31.12.2023 | 0.094 | 0.098 | 0.089 |
| 30.12.2023 | 0.109 | 0.118 | 0.098 |
| 29.12.2023 | 0.127 | 0.14 | 0.118 |
| 28.12.2023 | 0.155 | 0.179 | 0.14 |
| 27.12.2023 | 0.211 | 0.261 | 0.179 |
| 26.12.2023 | 0.308 | 0.369 | 0.261 |
| 25.12.2023 | 0.492 | 0.659 | 0.369 |
© Bayerisches Landesamt für Umwelt 2024